
An Economically Viable 100% Renewable Energy System for All Energy Sectors of Germany in 2030


1
Energy Watch Group, Albrechtstraße 22, 10117 Berlin, Germany
2
Department of Physics, Technische Universität München, James-Franck-Straße 1, 85748 Garching, Germany
*
Author to whom correspondence should be addressed.
Energies 2021, 14(17), 5230; https://doi.org/10.3390/en14175230
Submission received: 22 June 2021
/
Revised: 16 August 2021
/
Accepted: 18 August 2021
/
Published: 24 August 2021
(This article belongs to the Special Issue 100% Renewable Energy Transition: Pathways and Implementation II)
Abstract
:To be able to fulfil the Paris Climate Agreement and keep global warming with reasonable confidence at a maximum of 1.5 °C above pre-industrial levels, Germany must set an end to all greenhouse gas emissions by 2030. At the core of this task is the switch to 100% renewables across all sectors on the same time horizon. Conventional technologies fueled by fossil and nuclear energies are, according to the vast majority of current cost calculations, energetically inefficient, too expensive, and too slow in expansion to be able to deliver a substantial contribution to rapid climate protection. We present the first comprehensive energy scenario that shows the way to 100% renewable energy for all energy sectors by 2030. The result of the calculations is a cost-effective energy system that is compatible with the German share of necessary greenhouse gas reduction. This study shows a target system of generation, conversion, and storage technologies that can achieve the transformation to 100% renewable energy in all energy sectors—electricity, heat, and mobility—in time and at competitive costs below the costs of the current system. Moreover, we demonstrate the huge cost effect that arises if southern Germany renounces its onshore wind resources and find that this would substantially increase the need for high-voltage direct-current transmission capacity.
1. Introduction
The Federal Republic of Germany has signed the Paris Climate Agreement, which is binding under international law. The decision of the Federal Constitutional Court of April 2021 on the inadmissibility of the Climate Protection Act of 2019 criticizes a climate protection schedule that is incompatible with the Paris Climate Agreement. The resolution also indirectly pointed to the need for the development of a faster, more ambitious climate policy. Thus, with the currently envisaged CO2 emissions, any remaining budget, as documented by the Council for Environmental Issues, would be largely exhausted by the year 2030. As in most industrialized countries, compliance with the 1.5 °C target requires an end to all greenhouse gas emissions by around 2030. More than half of the human greenhouse emissions originate from the energy sector burning fossil fuels, particularly mineral oil, fossil gas, and fossil coal. Furthermore, only technologies that harvest renewable energies are scalable in time and space due to divisibility. Therefore, a fast switch to renewables in all energy sectors is indispensable to fulfil the Paris Agreement [1,2,3]. Carbon capture technologies as well as power from nuclear plants are also frequently brought to the forefront as relevant technical mitigation options. However, they are becoming increasingly irrelevant when confronted with the time scales left for the remaining switch to a climate-friendly system. Nuclear has an average construction time of seven years, while carbon capture is not capable of coming close to net zero at all. In addition, both are expensive, particularly through the various risks and resulting high capital costs. To the best of our knowledge, no up-to-date cost calculation in the literature derives any significant role for nuclear power or fossil fuels with carbon capture in an ambitious German climate scenario.
To assess the socio-economics of 100% renewable energy (RE) targets, energy system modelling serves as a main tool that assures both technical feasibility and cost effectiveness. Following Prina et al. [4], such energy system models may be classified in regard to the considered time horizon, covered energy sectors, geographical coverage, time resolution, methodology, and programming technique. Lyden et al. [5] and Xu et al. [6] compare different methods and modelling tools and their pros and cons. They also find that coupling of electricity to other energy sectors, such as transport and heating, is a crucial step to minimize costs and CO2 emissions [7]. A thorough overview of published studies is given by Hansen et al., who identify and analyze more than 180 articles on the development of 100% RE systems [1]. The importance of intersectoral coupling is reflected in the increased number of articles that cover several energy sectors and, thus, overcome the limited view of only the power sector [1]. Smart energy systems, i.e., systems that integrate multiple energy sectors [6], have been modelled for local, small scale systems such as villages and cities [8,9,10,11,12], as well as for the global scale [13,14,15,16]. The region that received the largest attention is Europe as a whole [17,18,19,20] and some nations such as Denmark [21,22], Ireland [23,24], Scotland, [25] Italy [26], and Finland [27]. Similarly, Germany has been modelled as a 100% RE system in different studies [2,3,28,29]. In particular, Hansen et al. carefully analyzed the role of various technical measures for the energy transition by 2050 [29]. However, not a single scientific contribution outlines a cost-minimizing technology pathway that is compatible with the Paris Agreement. We develop a scenario for 100% RE by 2030 to assess the deployment needed to keep the promise of Paris feasible.
The present study shows a target system of generation and storage technologies that accomplishes the conversion to 100% RE in all energy sectors–electricity, heat, and mobility. This cost-effective energy system allows for fast climate protection while maintaining energy supply security with energy demand coverage at every hour of the year and taking into account a reasonable electricity transport between northern and southern Germany. We confirm previous studies in the literature, [18,30] finding that less transmission lines are required due to efficient sector coupling, as well as the pronounced use of wind power. Furthermore, we achieve cost competitiveness, particularly when onshore wind power is developed in southern and northern Germany simultaneously, achieving a levelized cost of energy (LCoE) of as low as 76 Euro per MWh, which is not higher than that of the current system. In the future, the costs of new plants and the costs of generation must also be taken into account by the “Bundesnetzagentur”, the Federal Network Agency, which has, to date, refrained from the integration and generation options.
2. Model
For the optimization of renewable energy-based systems, we developed the energy system model EWG Mod. This model minimizes the economic costs by the optimal choice of investments and hourly energy generation of the technologies deemed most relevant in a linear problem framework. It finds an energy system based on fluctuating sources; alternatives for the utilization of bioenergy; and storage and conversion options for heat, electricity, and hydrogen with a total of 20 technology elements.
The objective function for cost minimization by the choice of generation q and investment k is the total levelized cost of the energy system, , and can be described as follows:
where denotes the capital remuneration factor, F denotes the fixed costs of the technologies denoted n, denotes the frequency of the time step t, and C denotes the variable costs of energy provision. The variable costs are further described by
where denotes fuel prices, denotes degrees of efficiency, and denotes the operating costs of technology n. The generation quantities must cover the exogenously given load in each time step. This can be implemented by the following equation:
It states that electricity generation in all electricity technologies L after subtracting battery charging current , hydrogen electrolysis current , and heat pump electricity , including net exports to other regions , covers classical electricity consumption in every time step t and in every region r. The net exports are limited by the available import capacity:
where denotes the import region and denotes the transport technology. The energy balance in the heating sector is represented by the following equation:
and it states that heat generation in heat technologies M and coupled heat generation in CHP plants with the heat index , after the deduction of the heat storage demand , covers the heat consumption . For the heat and electricity supply, the plant stock and new plants K can be used, which together make up the installed capacity . The available generation capacity , resulting from the installed capacity after the deduction of the unavailability, limits the energy generation . This can be mapped as follows:
Storage systems are another element of sector coupling alongside heat pumps and combined heat and power generation. The storage processes take into account the energetic storage capacities, the maximum charging speed, and the losses from the short-term and seasonal storage processes. The central relationship for the temporal development of the storage levels is modelled as follows:
This formulation divides the observation period into two parts: The first time step , where the state of charge is defined by the state of charge at the beginning of time step T and the change of this last time step T, as well as all following time steps , results from the changes compared to the previous time step.
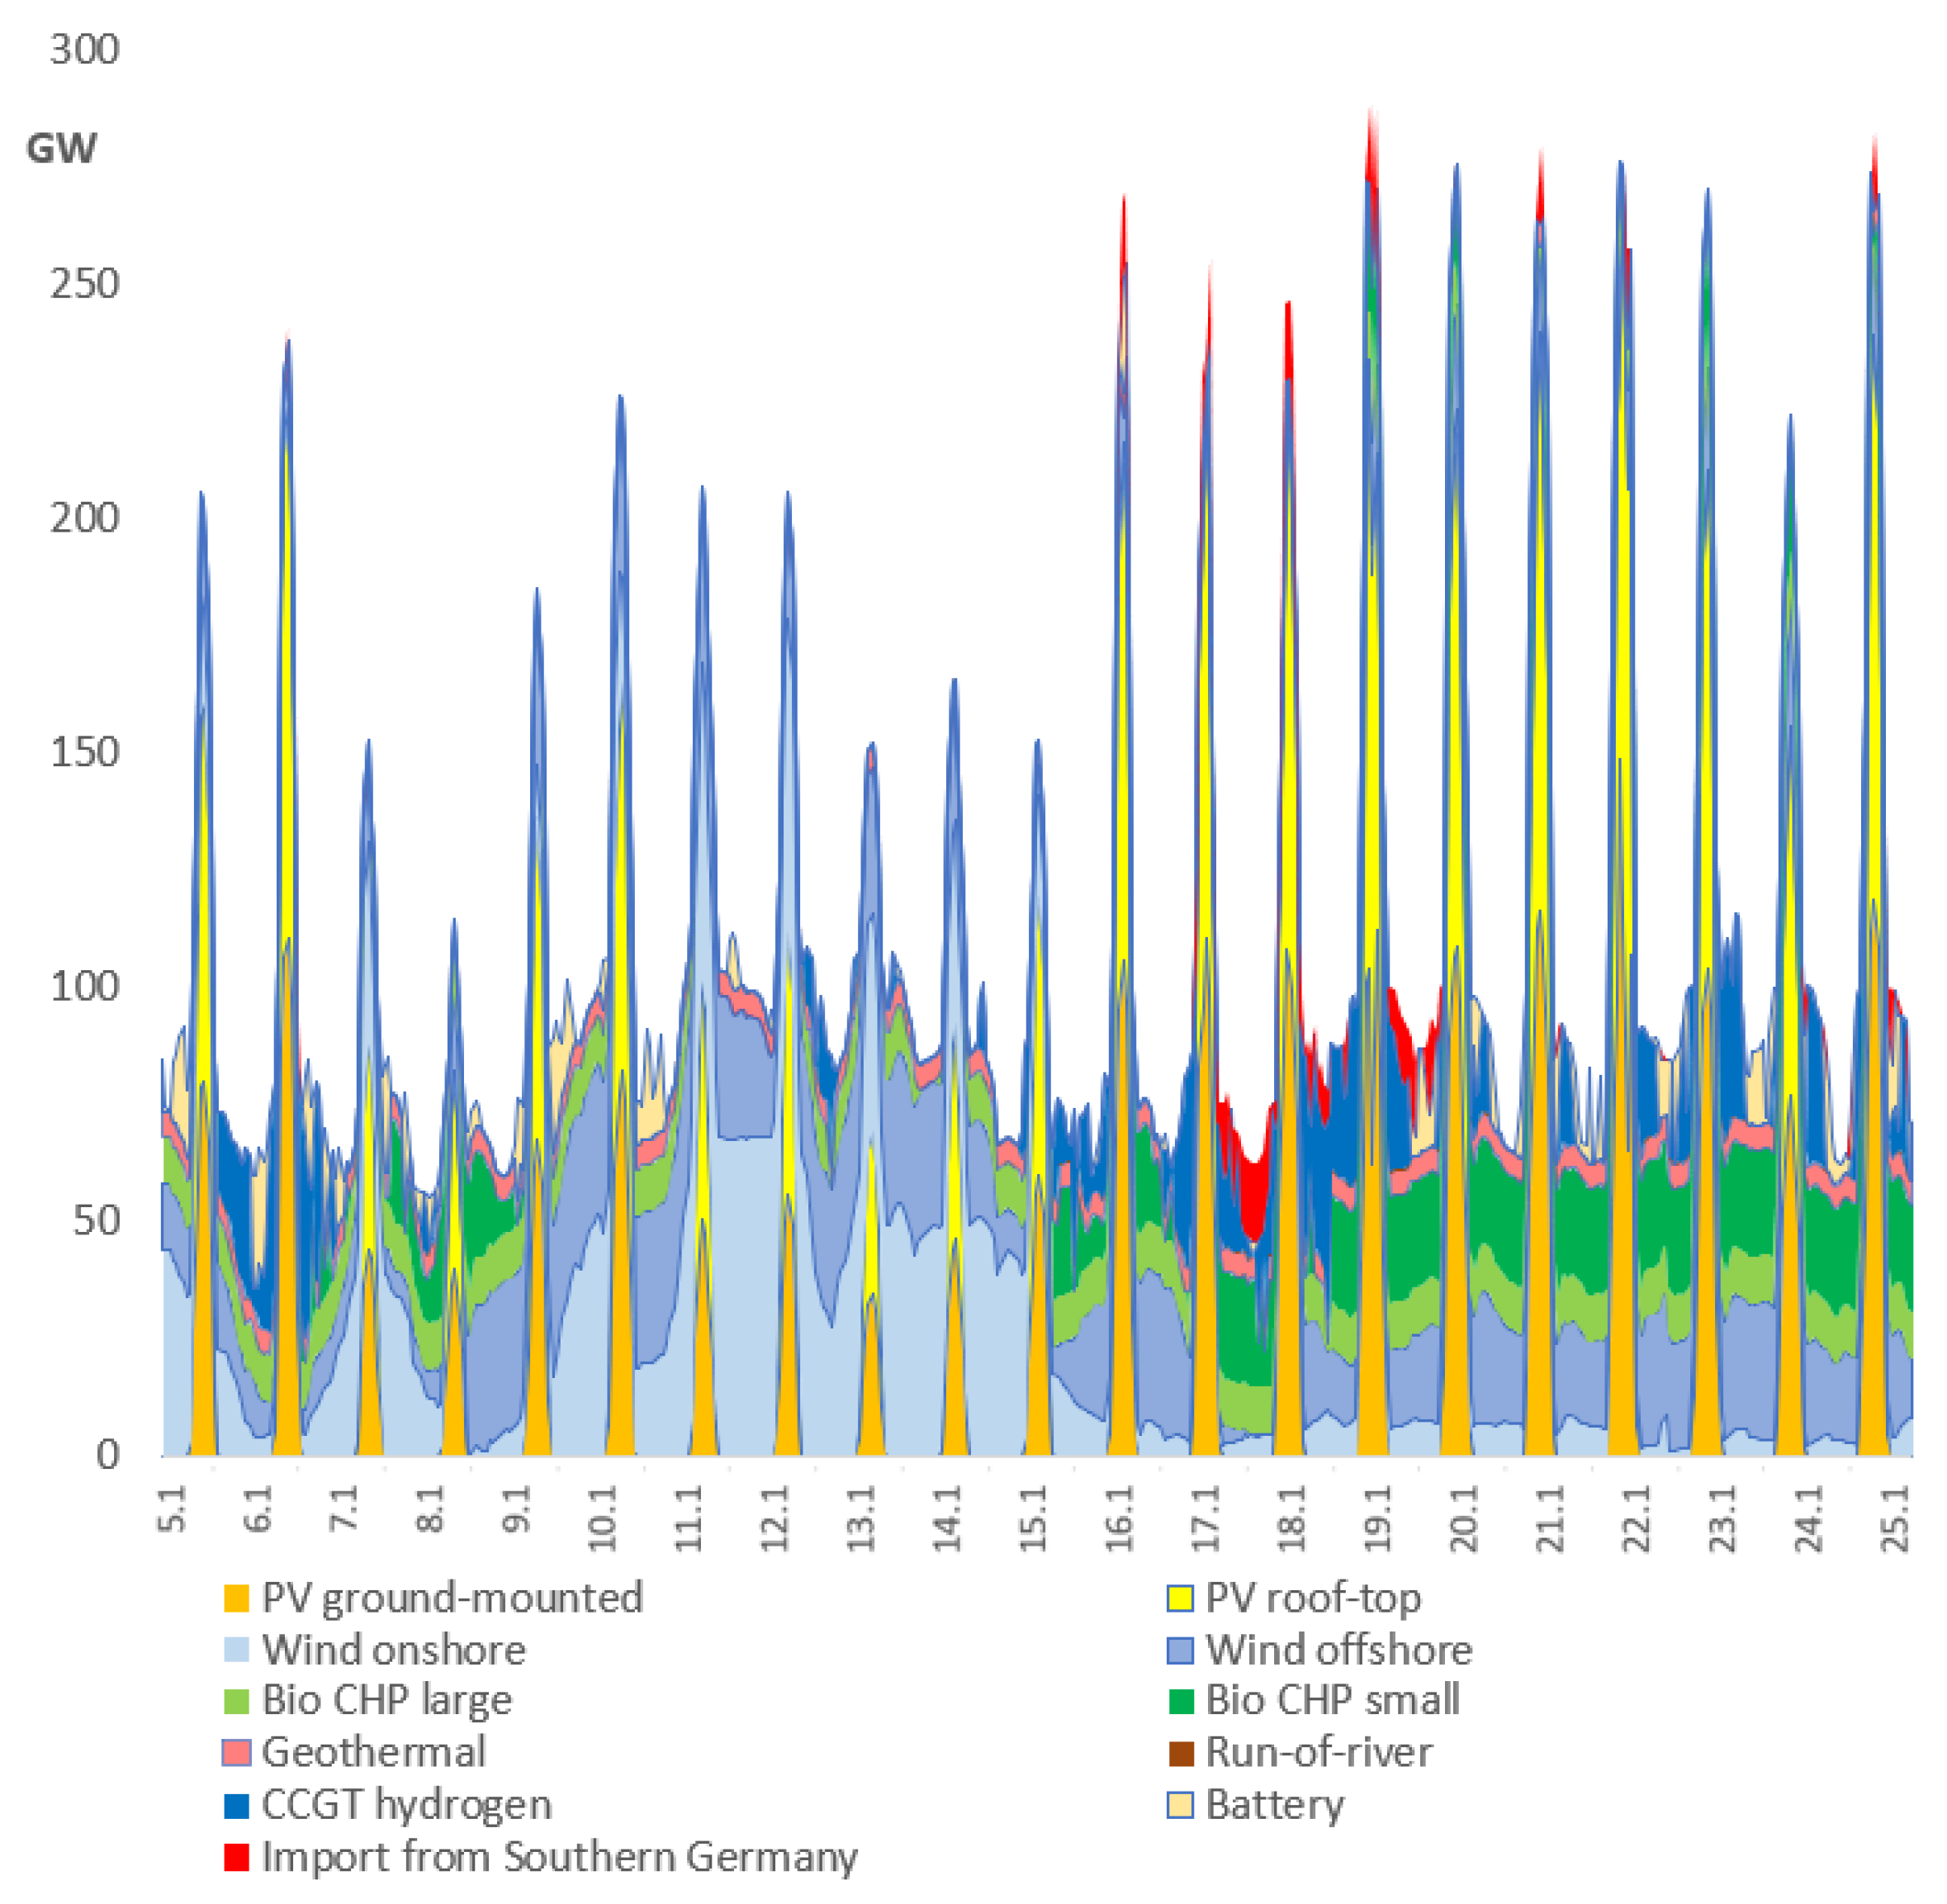
This representation allows the assignment of frequencies to specific periods to simulate critical meteorological weeks without overloading the model compilation with repeated calculations of moderate weeks. For this study, we use the critical 3-week period from 5–25 January 2017, which represents an empirically outstanding event in terms of low availability of fluctuating renewables, as shown in Figure 1 and Figure 2 below using the central scenario (EWG Scenario) of this study. It shows the resulting generation profile in the critical situation of lowest wind generation in northern Germany from 17–24 January 2017, which followed a period of very low PV generation, particularly in southern Germany, from 8–15 January, and which simultaneously experienced high demand for heat and electricity on the consumption side. The remaining weeks are chosen to most closely resemble the total renewable energy yield and total consumption of an average year.
For this purpose, a period with high solar energy availability and comparatively low consumption, namely, the week of 19–25 May 2017, and meteorological periods with average yields for wind from 23–29 October 2017, are used. The weights are then assigned to these periods simulating a total of 8760 operating hours. The goal of this procedure is to assess both the physical challenges of extreme periods as well as to illustrate the economic significance of power system conditions around the annual average. This framework is applied to the problem of choosing the optimal energy technology mix at 2025 medium-term costs on a possible path to zero emissions, i.e., the choice of a cost-minimizing planner with the option of immediate “overnight” investments. We thus abstract from intertemporal issues, such as limited foresight, construction times, and endogenous learning effects between 2021 and the year of completion considered necessary, 2030. We also assume full replacement of conventional fossil energy, which tends to overestimate the impact of costs relative to the impact of lobbying for favorable market conditions and infrastructural lock-in. However, this does not affect the significance of the results in terms of cost minimization, which lead us to the most ambitious climate change mitigation path possible.
3. Data for Germany
3.1. Current Situation in Germany—Energy Demand and Costs
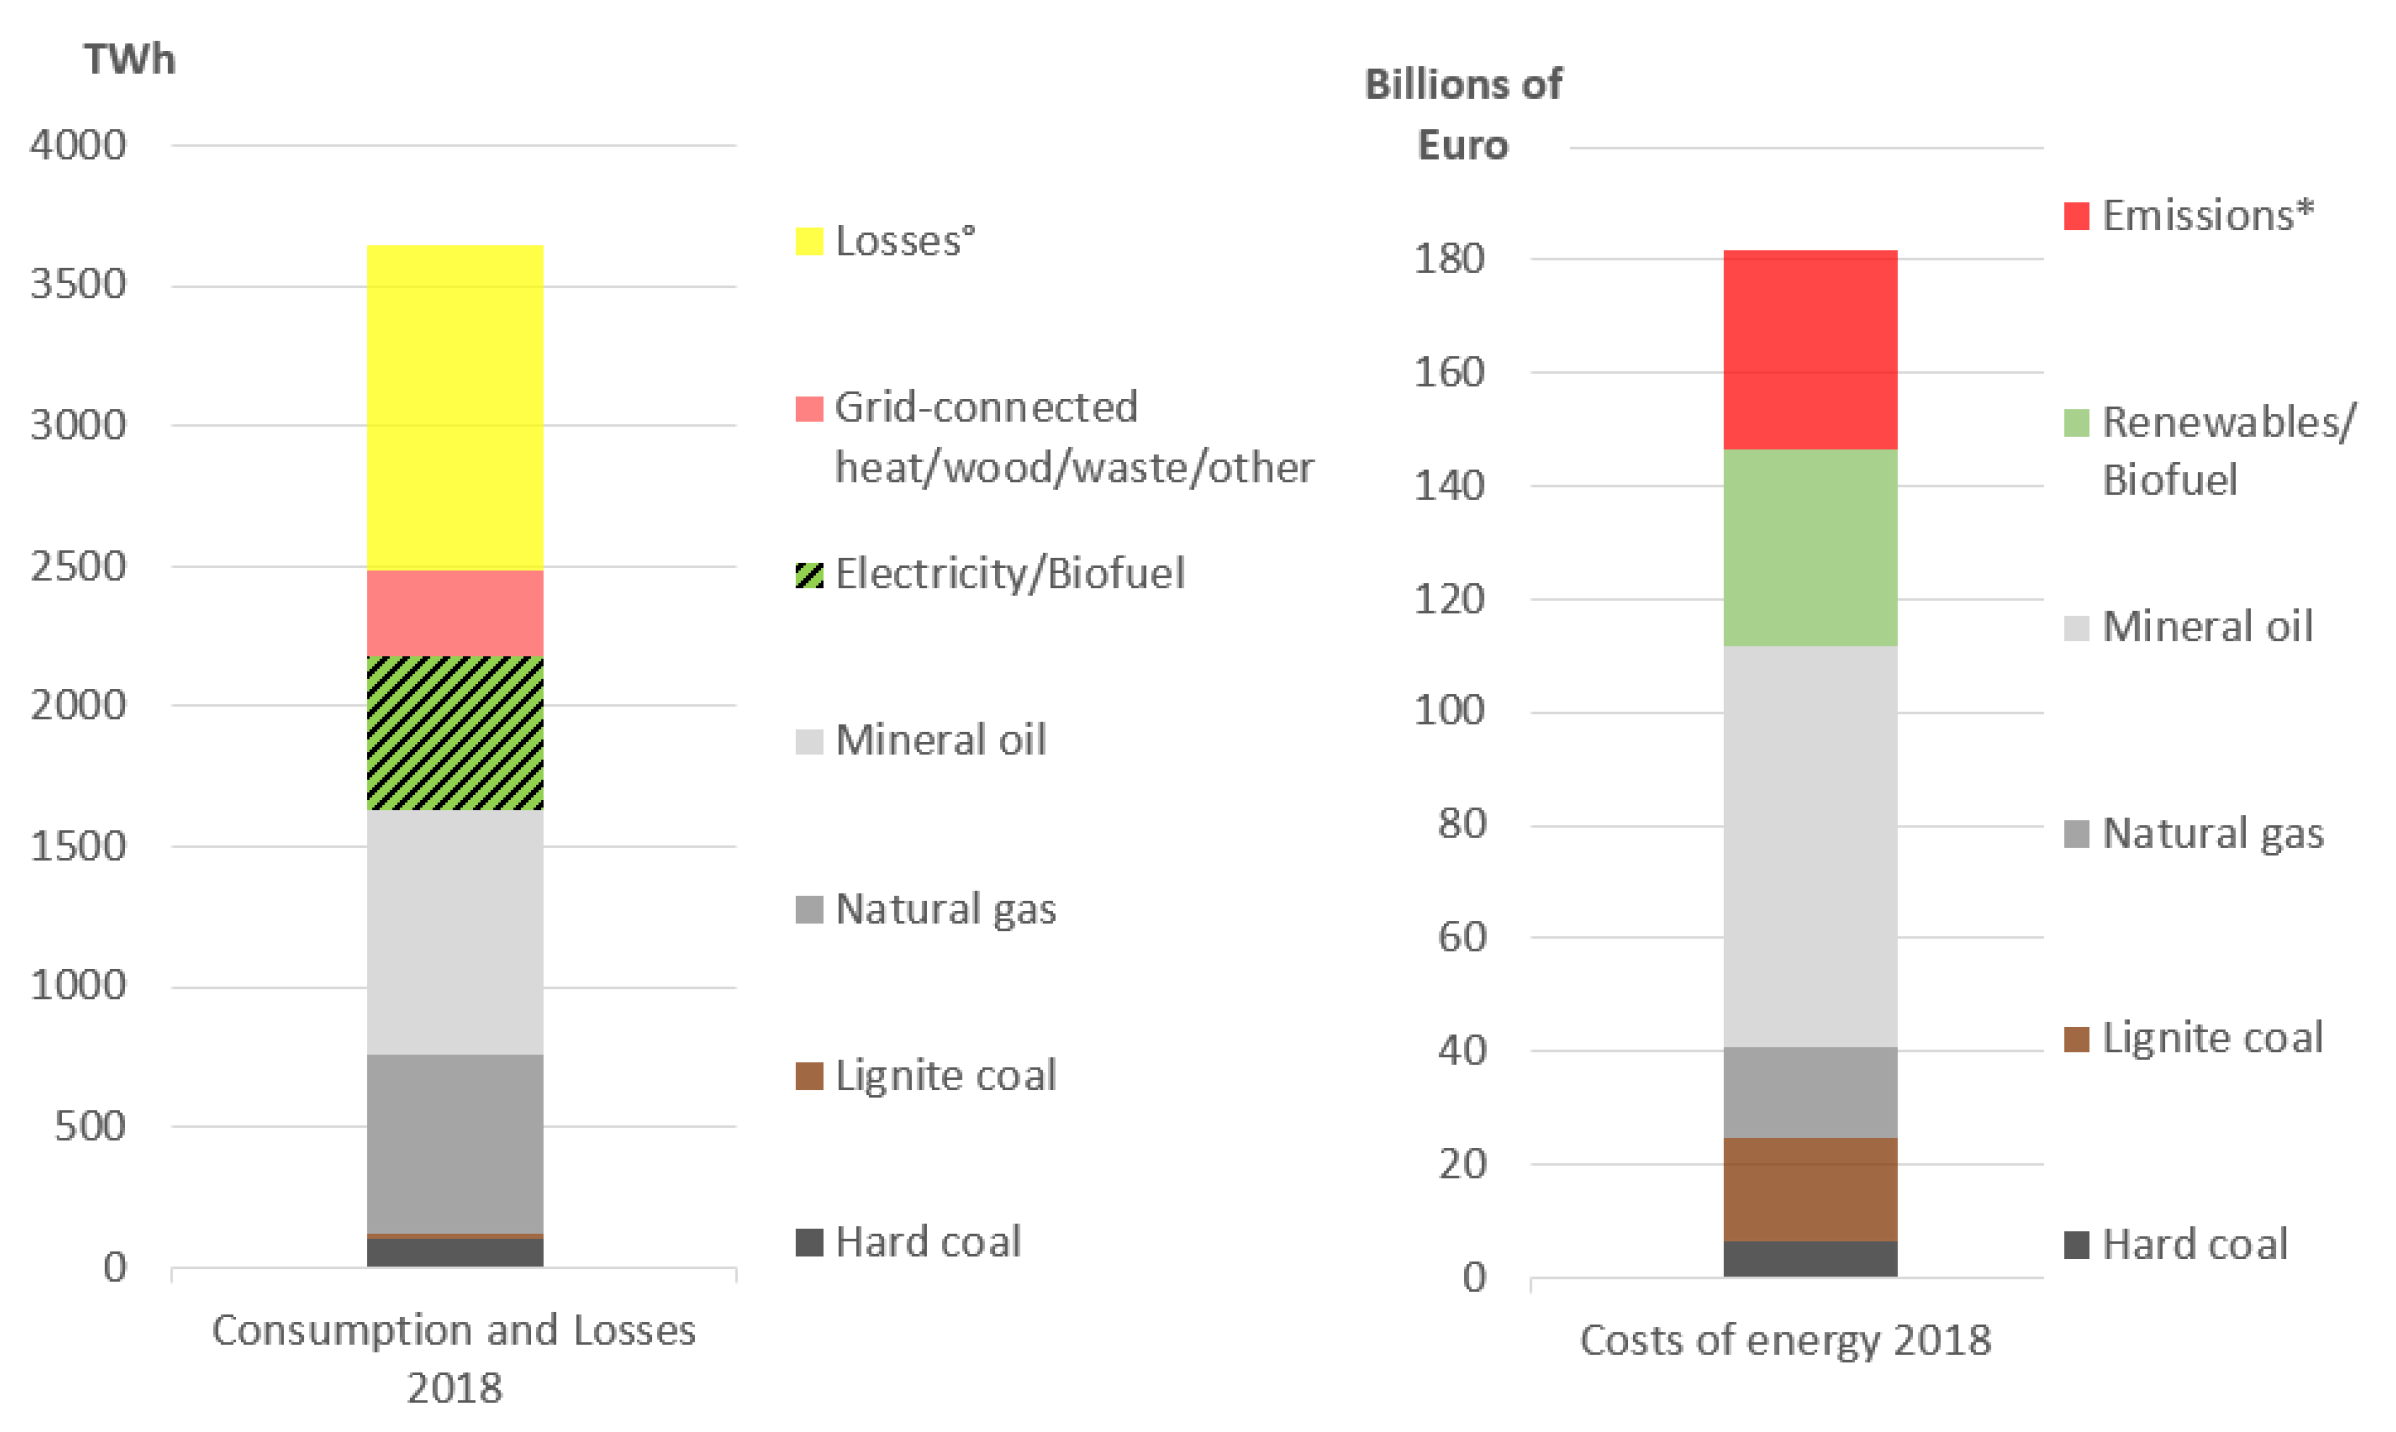
Today’s energy supply in Germany is mainly based on natural gas and mineral oil in the heating and transport sectors, which together accounted for more than 1500 TWh out of nearly 2500 TWh of the total final energy consumption in 2018 (Figure 3, left). The electricity sector contributed 513 TWh and, together with biofuels, provided a total of 548 TWh. Grid-connected heat contributed another 315 TWh. Conversion and grid losses and non-energy consumption accounted for about 910 TWh out of 3647 TWh of the total primary energy consumption in 2018. The electricity sector currently has a green electricity share of 50% of net electricity consumption. In the heat and mobility sectors, the share of green energy has been significantly lower to date.
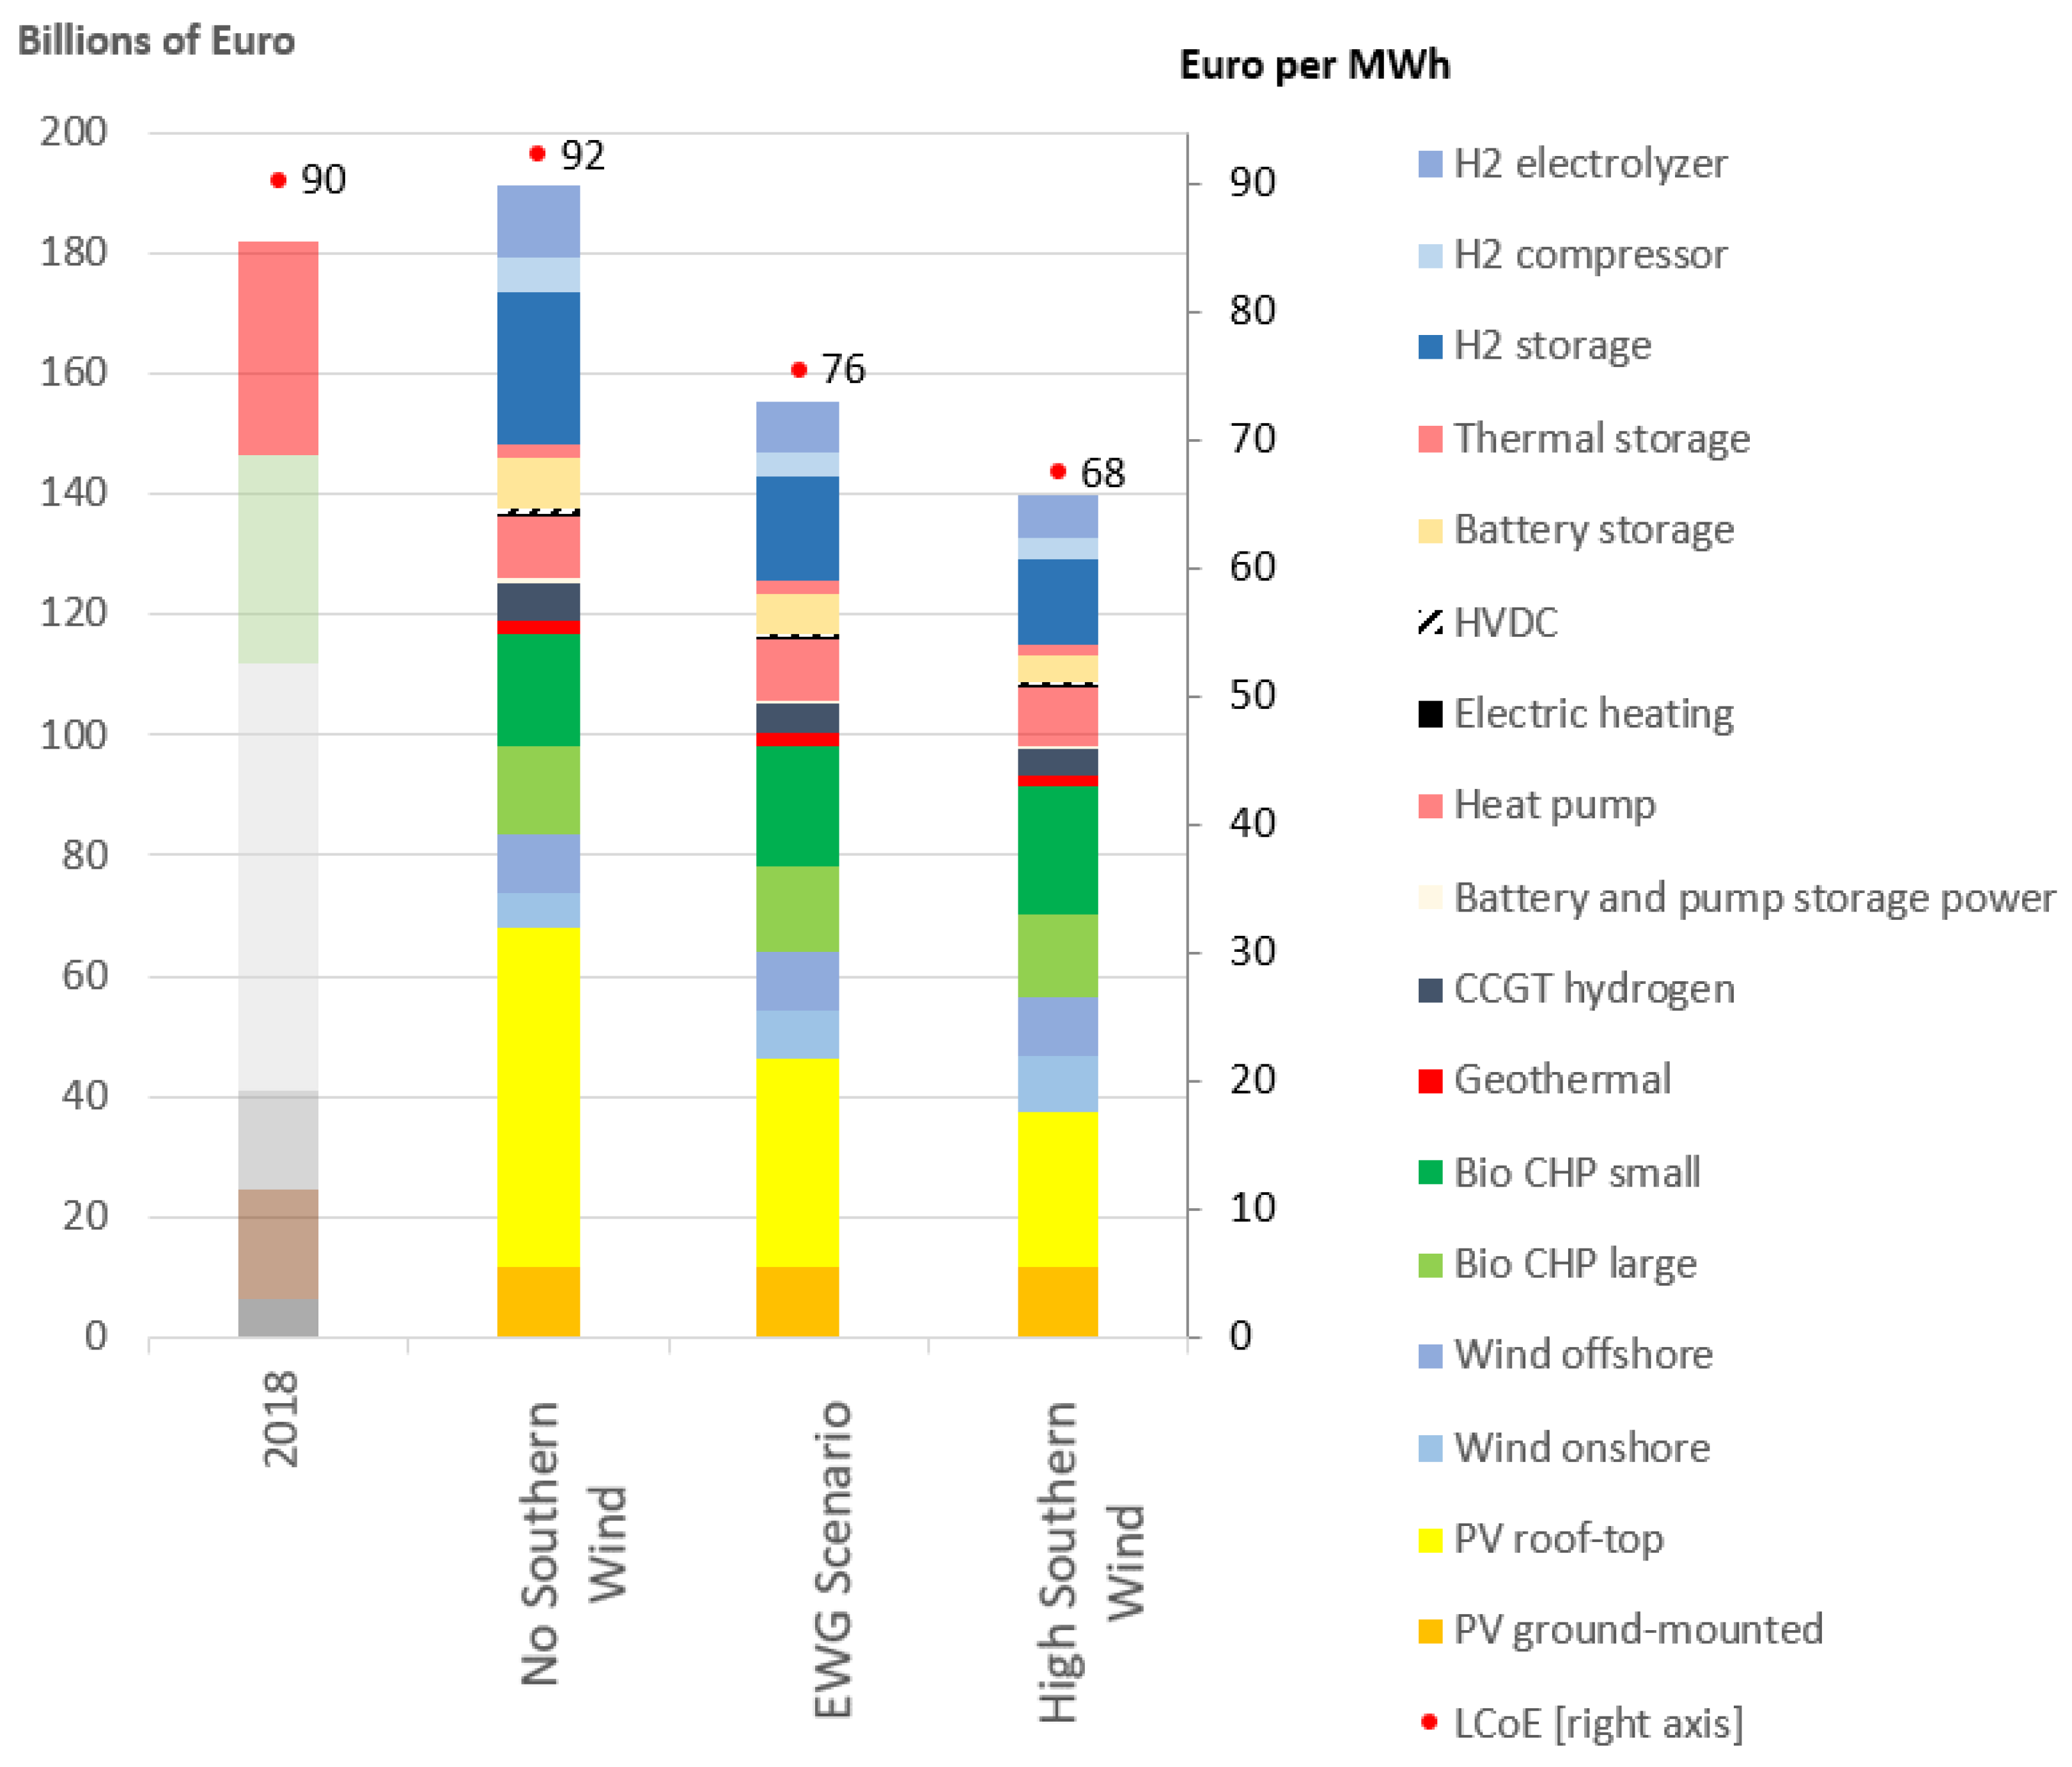
In 2018, fossil energy fuel costs were more than EUR 100 billion, and, including depreciation for conversion equipment of an estimated EUR 12 billion, total fossil energy costs were at EUR 112 billion (Figure 3, right). Renewable energy costs totaled about EUR 35 billion, and renewable and fossil energy supply costs summed up to about EUR 147 billion. Including the cost of CO2 emissions, the total German cost of energy provision was EUR 182 billion. This corresponds to energy and damage costs averaging EUR 90 per MWh hour for all energy sectors, not including the cost of nuclear energy. Here, and in the following, the major parts of infrastructure costs for energy transport, transmission, and distribution are not included.
3.2. Foundations for a 100% RE System in 2030
Starting points for the development of a cost-effective energy system based on 100% renewables are the final energy demand to be met, the potentials for expansion, and the existing RE plants. These are divided as described below for the consideration of geographical differences and the electricity grid between northern and southern Germany. For the total final energy demand of Germany to be covered by the energy system, 1102 TWh heat demand and 967 TWh electricity demand are assumed. This includes 567 TWh of conventional electricity use and 400 TWh of electricity for the transport sector. For the heat sector, this means that a significant increase in use efficiency can be achieved, especially in the building sector, by a total of 217 TWh compared to 2018. In the electricity as well as in the heat sector, the ratio of the distribution of consumption between the north and south is about 3:2 [32], and is also taken as such for the year 2030.
3.2.1. Existing Transmission Capacity
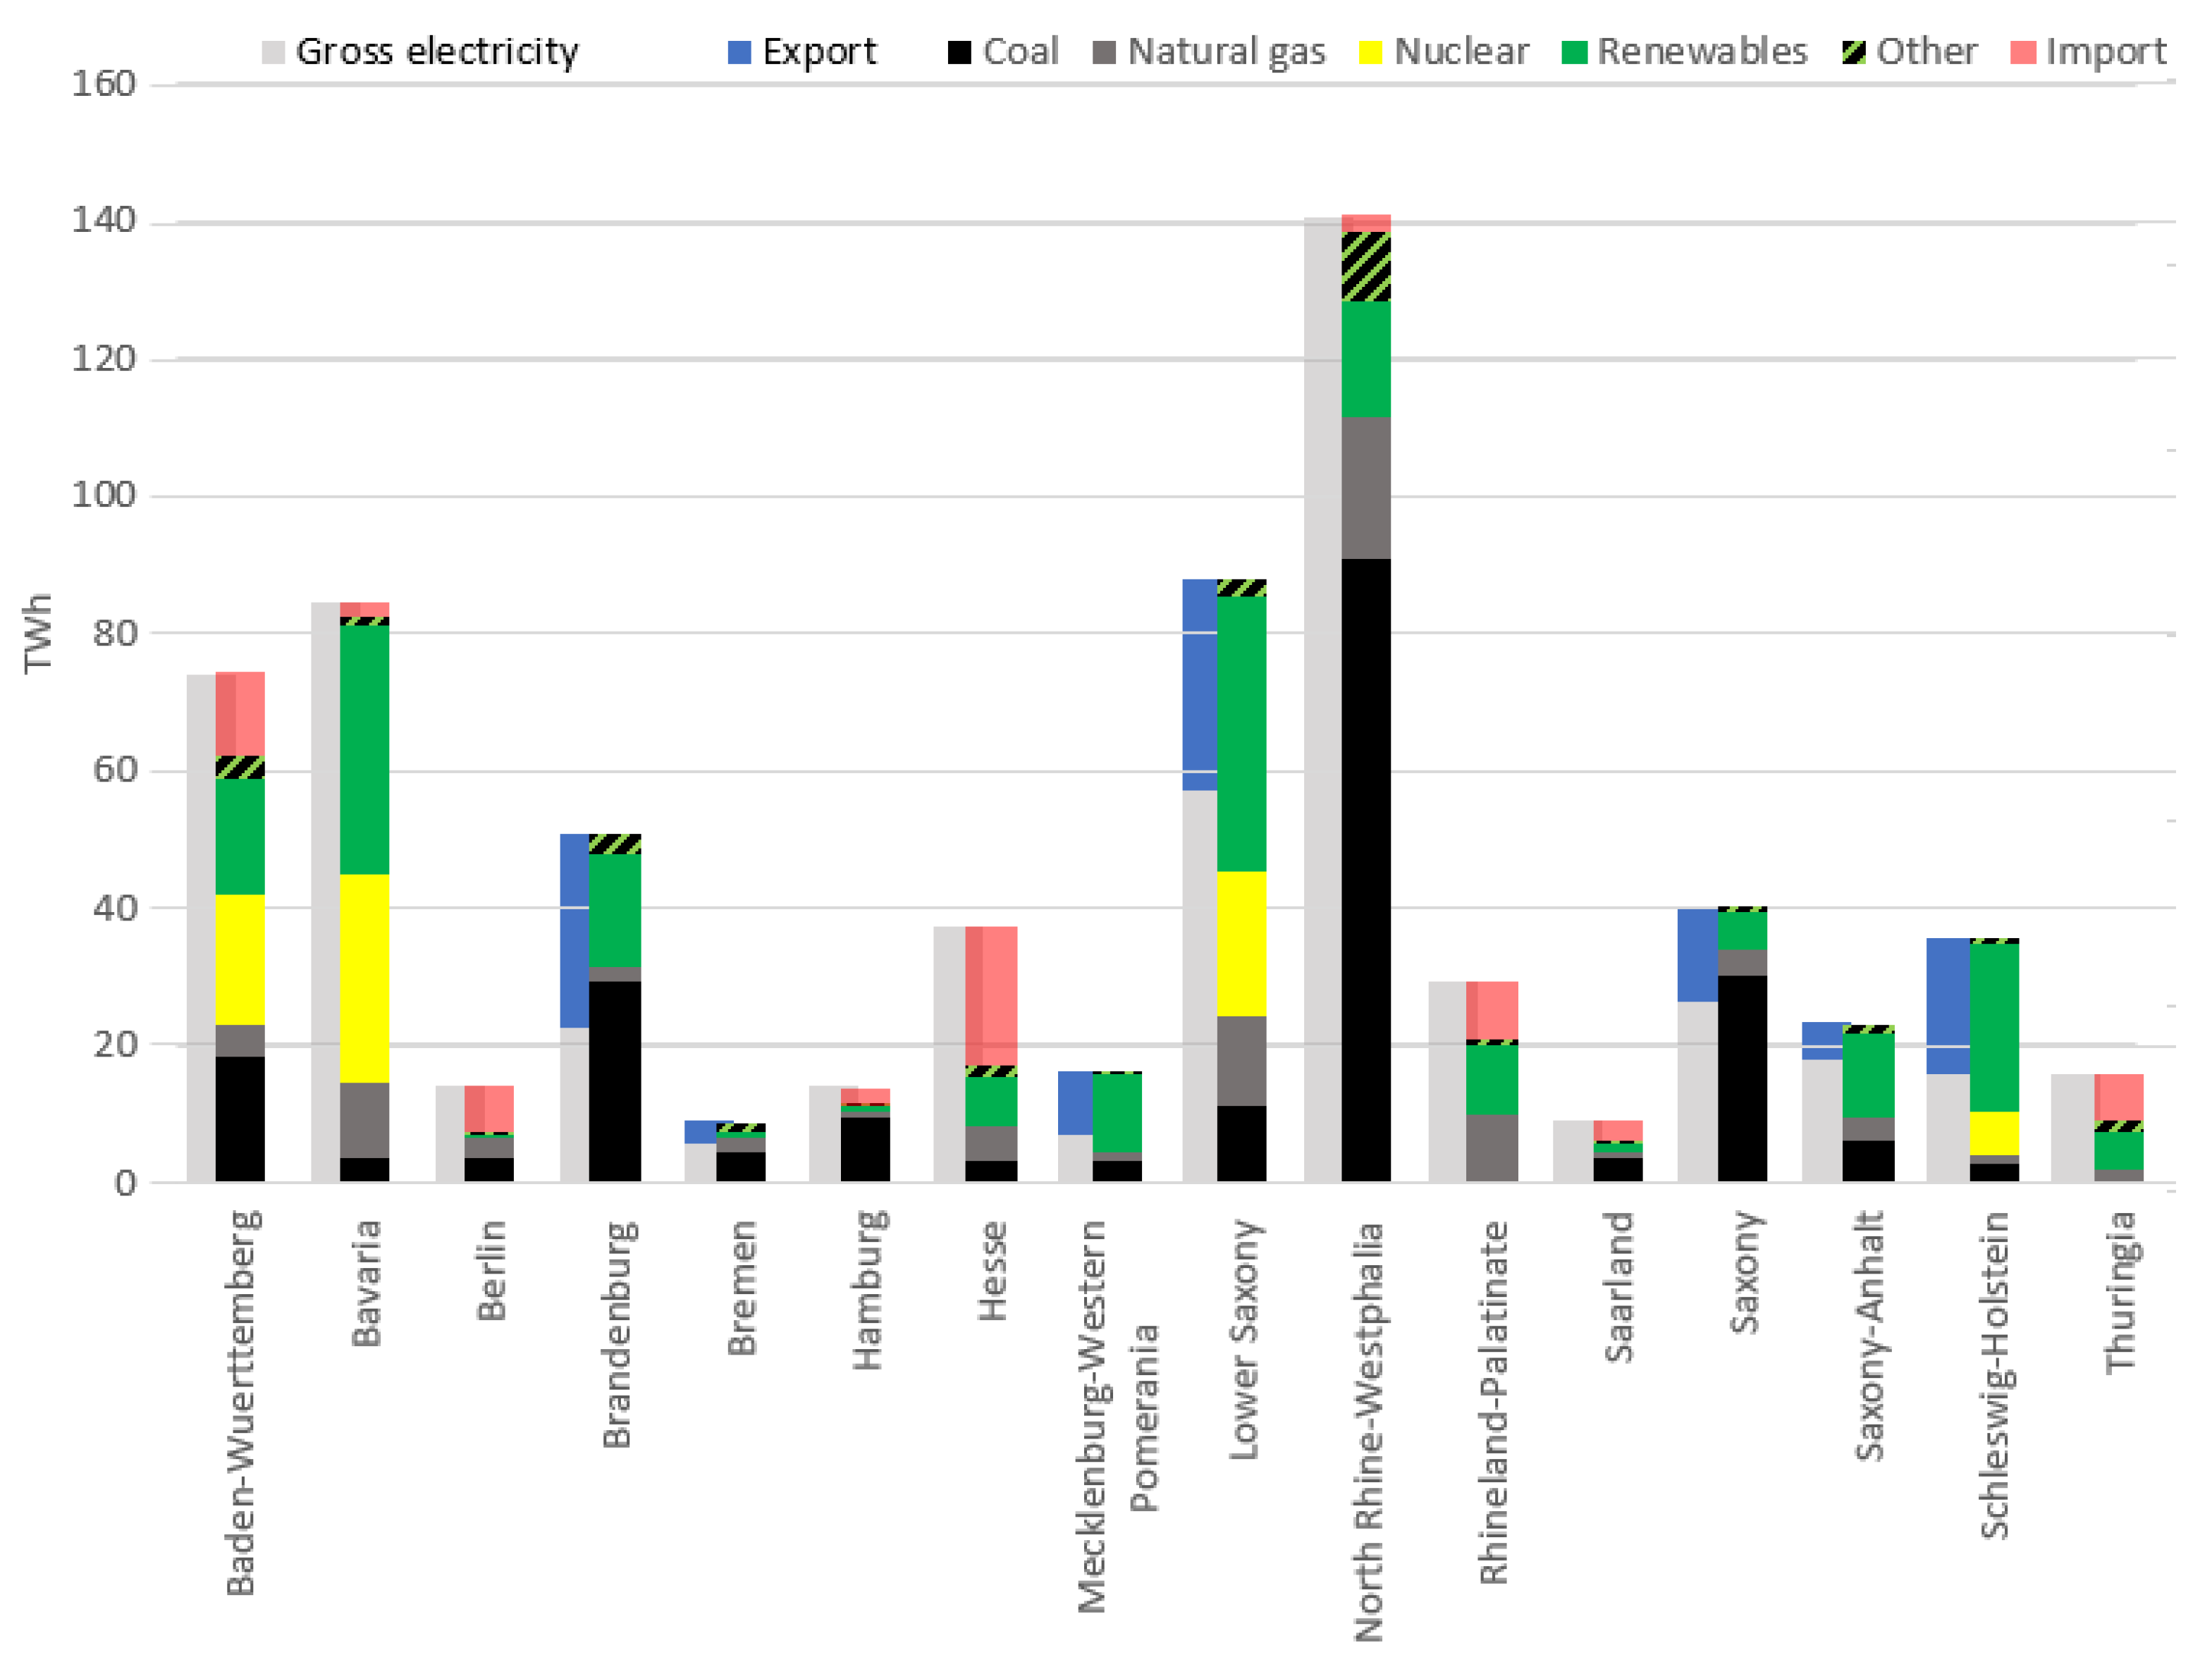
The existing network capacity between the north and the south of Germany is calculated on a balance sheet basis due to the lack of official data on the actual load flows. For this purpose, Germany’s physical load flows with foreign countries are broken down by federal states and are netted together with the gross power generation balances of the federal states that are shown in Figure 4. This results in a regional physical trade balance between northern and southern Germany of 44 TWh for 2018. In total, an average of 5 GW of transmission capacity from north to south was thus used throughout 2018. This results in an existing domestic transmission capacity of at least 8.9 GW if utilization of the lines in the north–south direction of 59% is conservatively assumed. For a more precise determination of the variables, country balances with a higher temporal resolution are necessary, which are also required for the further planning of the energy transition, its analysis, and optimization.
3.2.2. Existing Capacities and Expansion Potential of RE Sources until 2030
The existing power generation capacities in 2020 as well as the potentials to be developed by 2030—i.e., the technically available and conceivable expansion possibilities by 2030—in regions and technology types are broken down in Table 1 and form the basis for the following calculations.
3.2.3. Consumption and Generation Profiles in Northern and Southern Germany
The full renewable energy supply simulated here optimizes the balancing of the seasonal and daily varying consumption profiles with the fluctuating generation possibilities, especially of wind and sun power. The corresponding profiles of the year 2017 in hourly resolution are used for this purpose. The wind technologies and possible wind power generation profiles used here are based on calculations by the Technical University of Denmark DTU [34] and assume onshore wind power expansion according to their scenario C with a comparatively high share of renewable energy included in the 2020 scenario framework for federal grid planning [32].
4. Results
In this section, we feature a central scenario, which we name EWG Scenario, as it is developed by the Energy Watch Group. In this scenario, costs are minimized for a zero-emissions energy economy with 100% RE for all energy sectors, assuming a wind onshore deployment in southern Germany that equates the full potential identified in the previous section. Additional information is obtained from two further scenario calculations referred to as No Southern Wind, without wind power expansion in southern Germany, and High Southern Wind, with doubled potential of wind that is often estimated to be achievable only in a longer time span.
In the following, we prominently emphasize the results of the central EWG Scenario. The necessary expansion requirements for 2030 are subsequently broken down and discussed against the background of today’s energy economic situation.
4.1. Capacities for an Emission Free Energy System
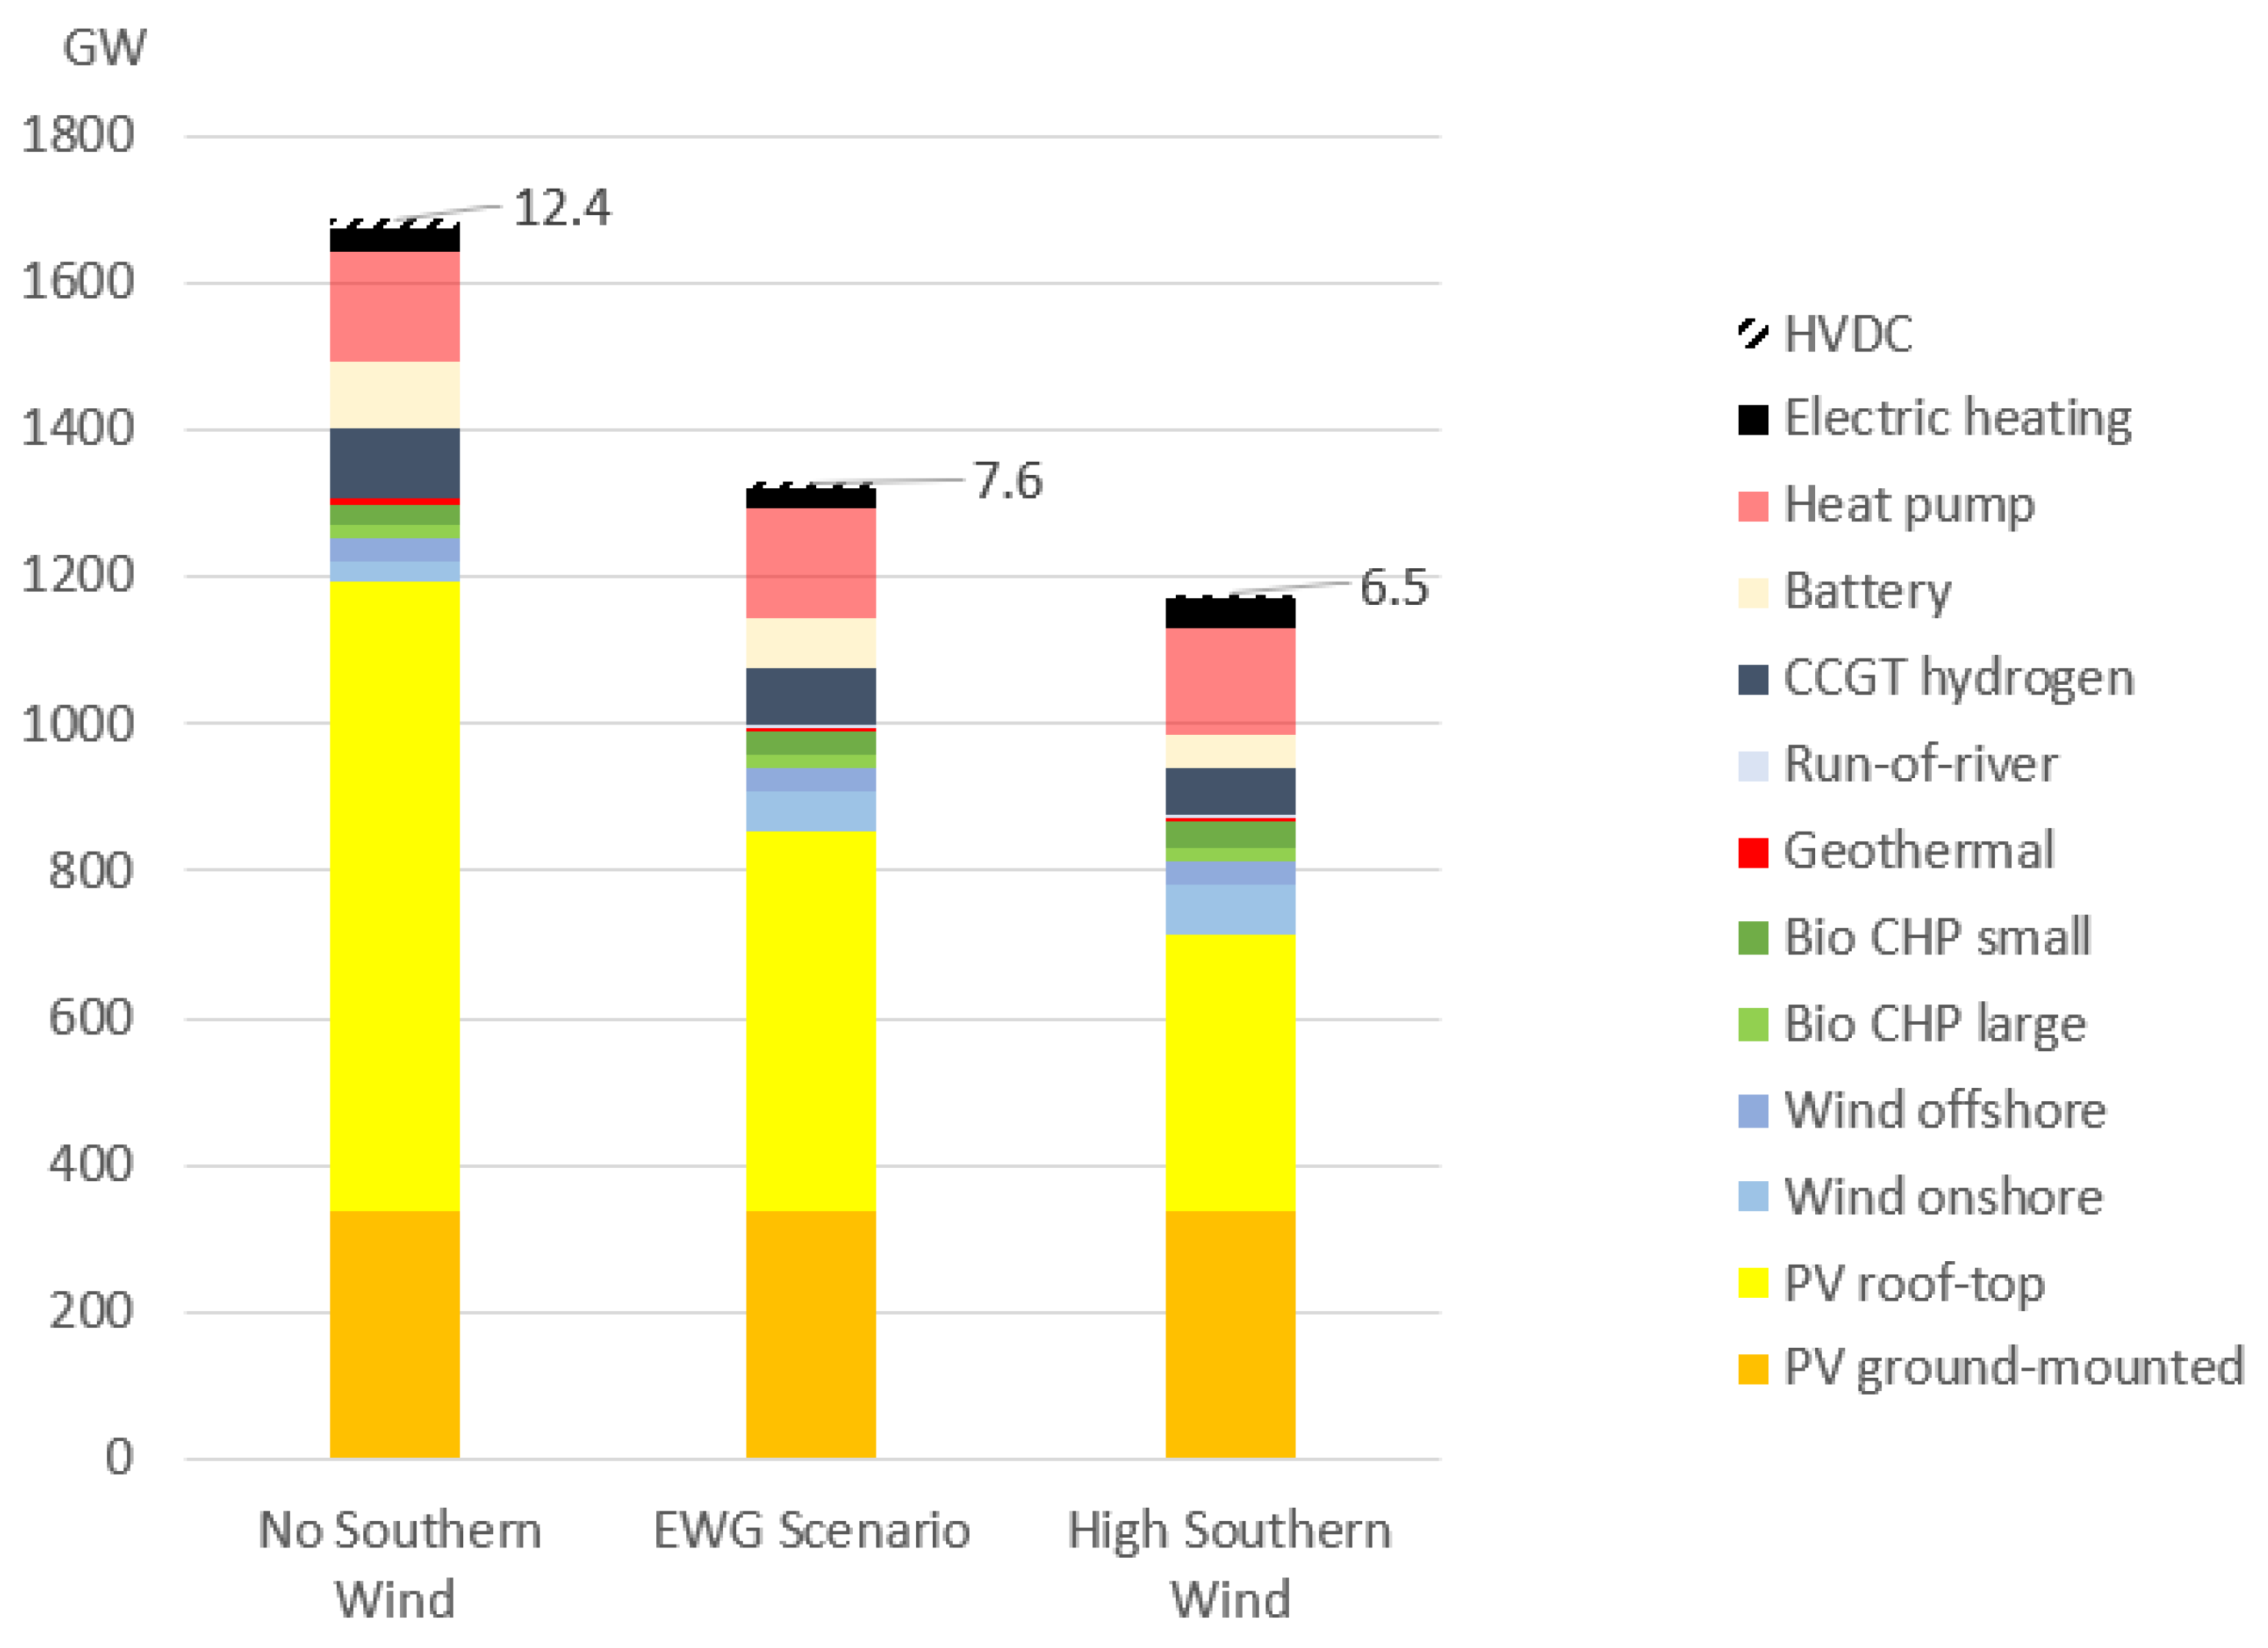
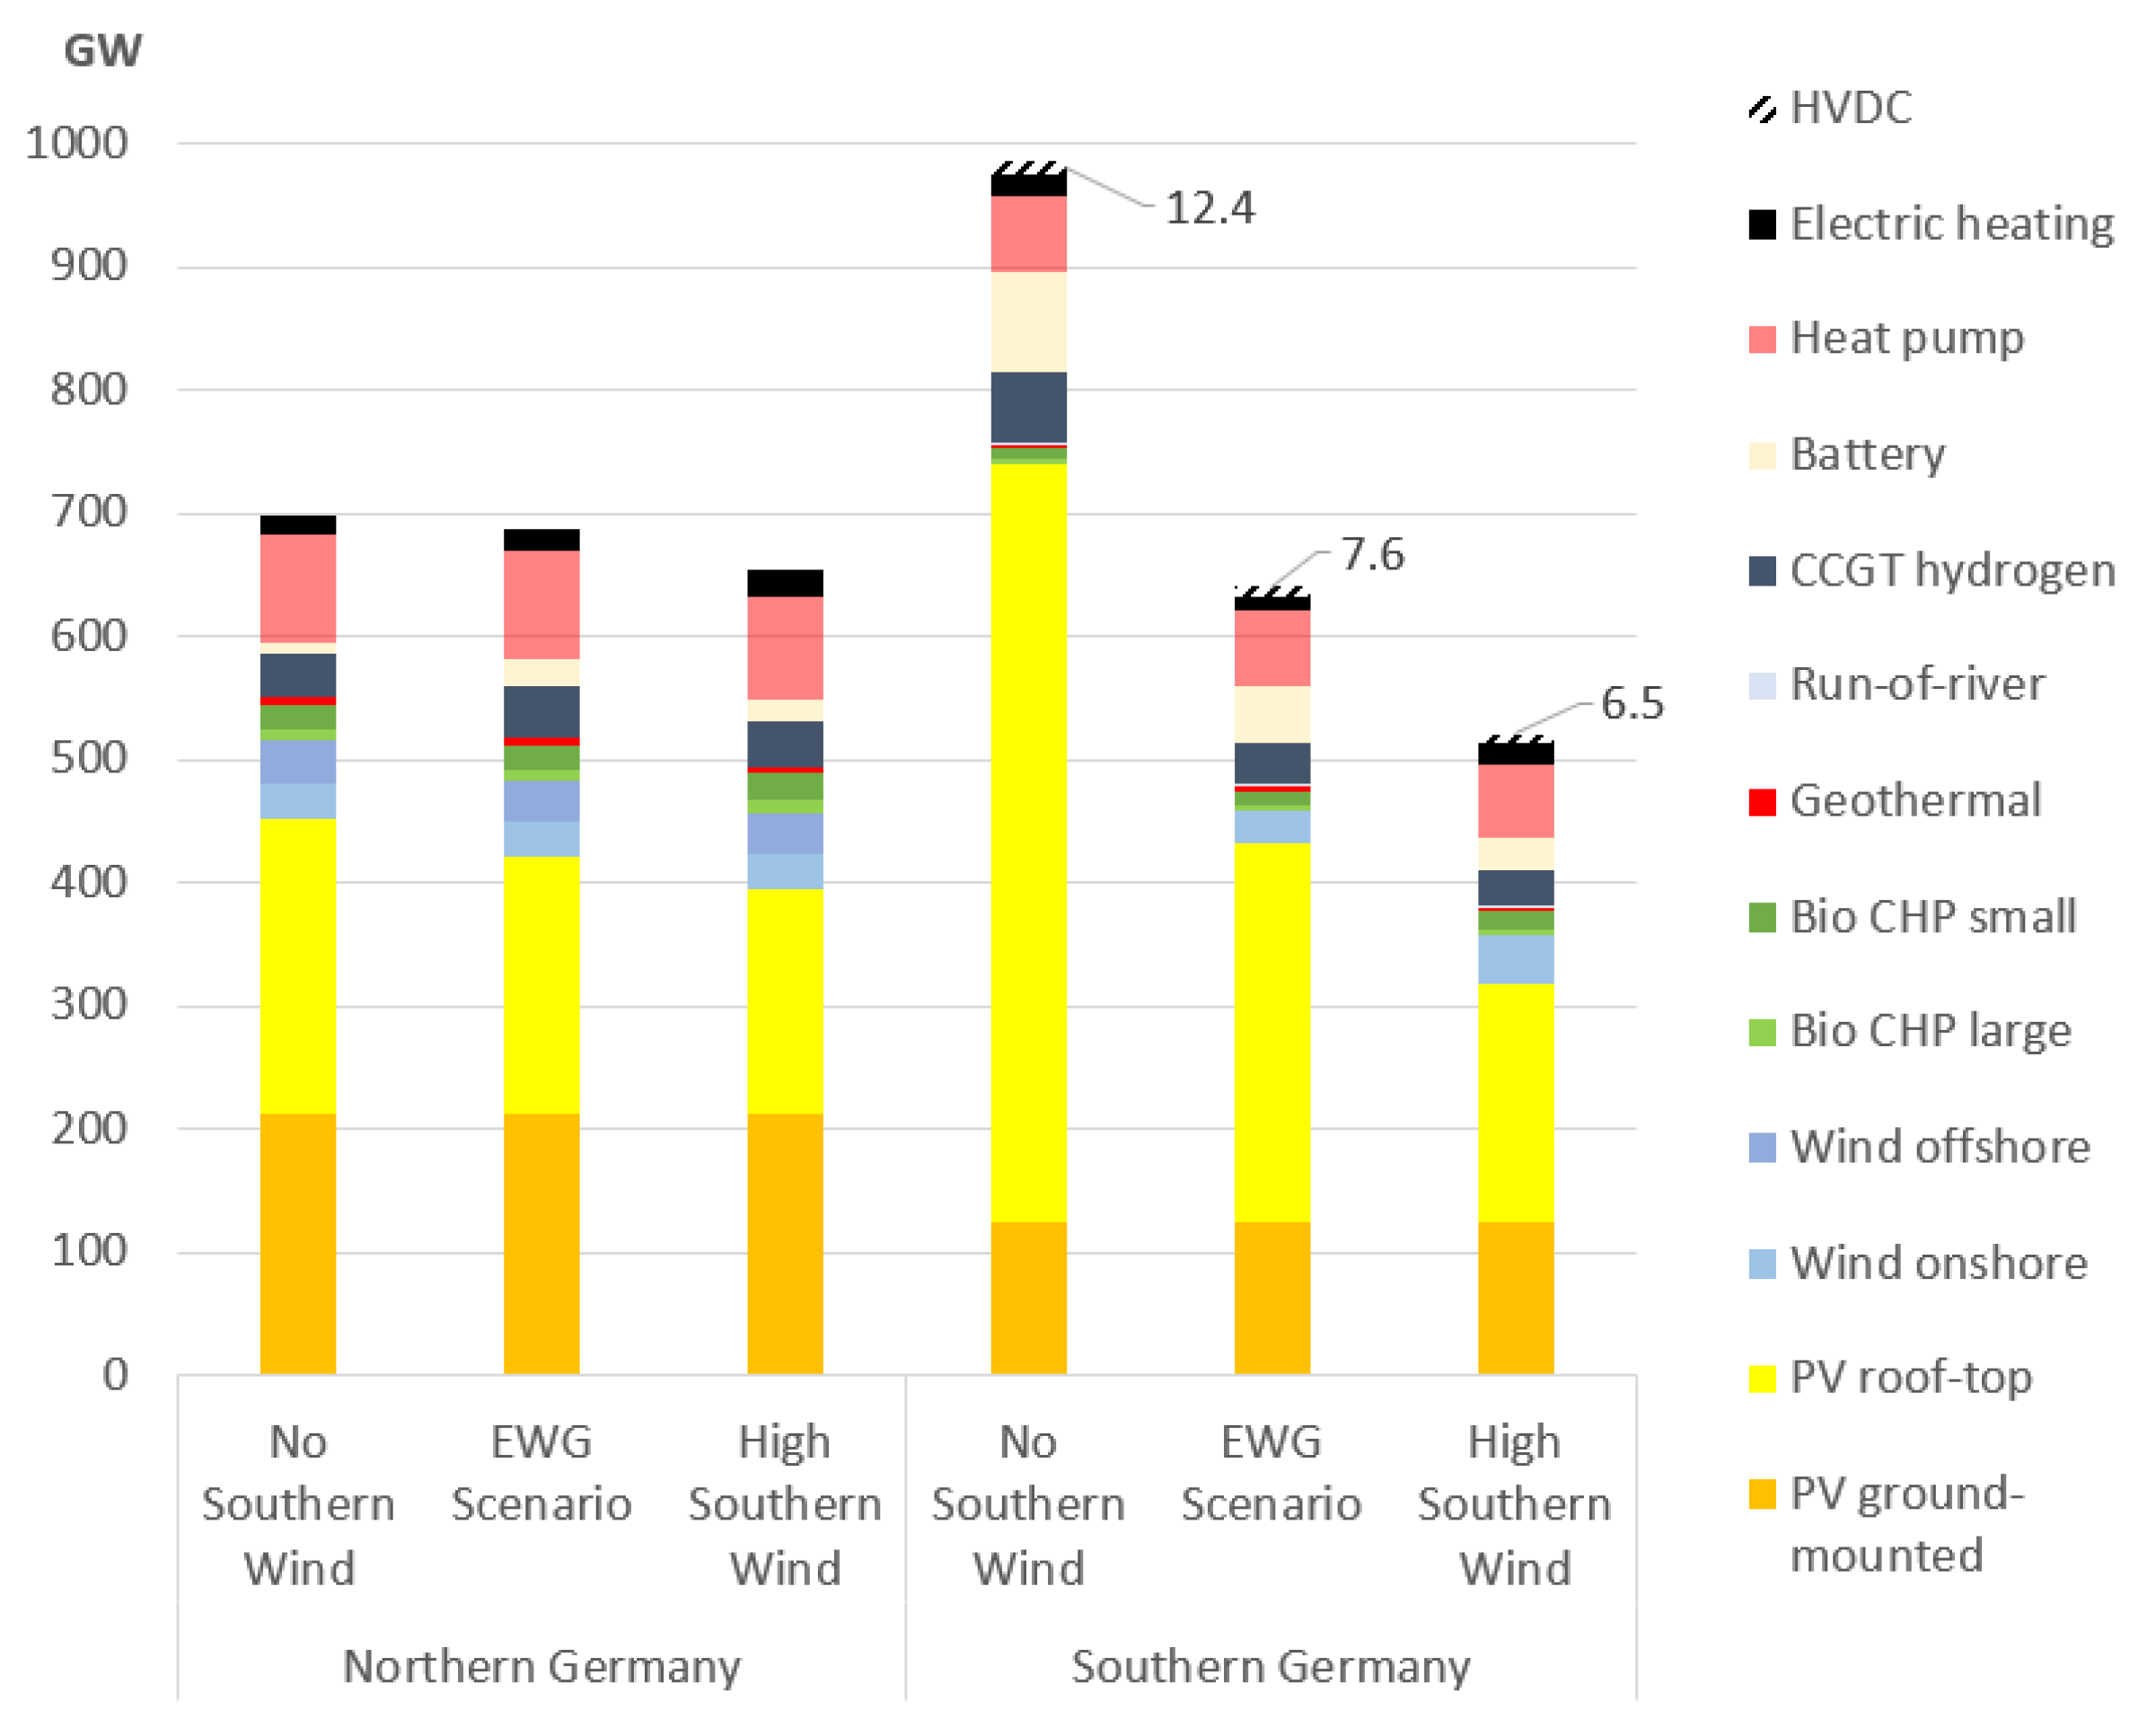
The energy conversion capacities of the target system for 100% RE of the EWG Scenario are shown in comparison with the No Southern Wind and High Southern Wind scenarios in Figure 5. Newly installed electricity generation capacity is 1143 GW for the target system (EWG Scenario) in northern and southern Germany combined, of which more than 80% (941 GW) are photovoltaic and wind power plants. The capacity secured at all times is provided by bioenergy cogeneration plants and geothermal, run-of-river, hydrogen, battery, and pumped storage, and it amounts to 103 GW in the south and 105 GW in the north. The capacity of southern Germany is attributed here to the expansion of 7.6 GW of high-voltage direct-current (HVDC) transmission lines, which predominantly transport electricity from the north to the south. By far the largest share of electricity generation capacity, especially in southern Germany, is accounted for by building photovoltaic plants, whose share of total photovoltaics is 51% in the north and 71% in the south, as shown in Appendix B (see Figure A1). Neglecting wind power expansion in southern Germany has a significant impact on the optimal energy system in the southern part as is immediately apparent by comparing the target system EWG Scenario with No Southern Wind. Not only would 2/3 more PV plants be required, but also an almost 2/3 (61%) greater line expansion would be economically necessary. In other words, a renunciation of 26 GW wind energy potential means a necessary additional PV expansion of 339 GW supported by additional storage and hydrogen production. By contrast, the doubling of wind expansion in southern Germany under High Southern Wind would save only another 139 GW or 27% of PV expansion compared to the EWG Scenario.
4.2. Cross-Sectoral Electricity Generation for Full Climate Protection in Germany
The coupling of electricity generation in northern and southern Germany for the electricity, heat, and transport sectors in the minimum-cost case is shown in Figure 6. The necessary electrification of all energy sectors increases the electricity generation compared to 2018 from about 567 TWh to almost 1670 TWh in the target scenario (EWG Scenario), with the transport sector accounting for about 400 TWh and the remaining additional electricity generation used for loss compensation and the heat sector. A mix of many different renewable energy types is needed, with about 80% wind and solar (PV). Batteries, geothermal, and hydropower account for about 12% nationwide. If wind energy expansion in the south is abandoned, PV shares in energy supply would need to increase from 45% to 53%, while PV’s total energy supply would increase by 16%. The doubling of wind expansion in southern Germany simulated in High Southern Wind yields a comparably sized effect on PV compared to the EWG Scenario in the opposite direction.
4.3. Heat Supply: Coupled, Stored, or All-Electric
The heat supply of the target system EWG Scenario is also based on a strong expansion of heat pumps, which account for around 59% of the heat supply nationwide, regardless of the scenario considered. A further 20% is provided by biogas and biomass-fired cogeneration plants. The technology shares in heat supply are largely stable across all simulations.
4.4. Energy Storage for the Energy Transition
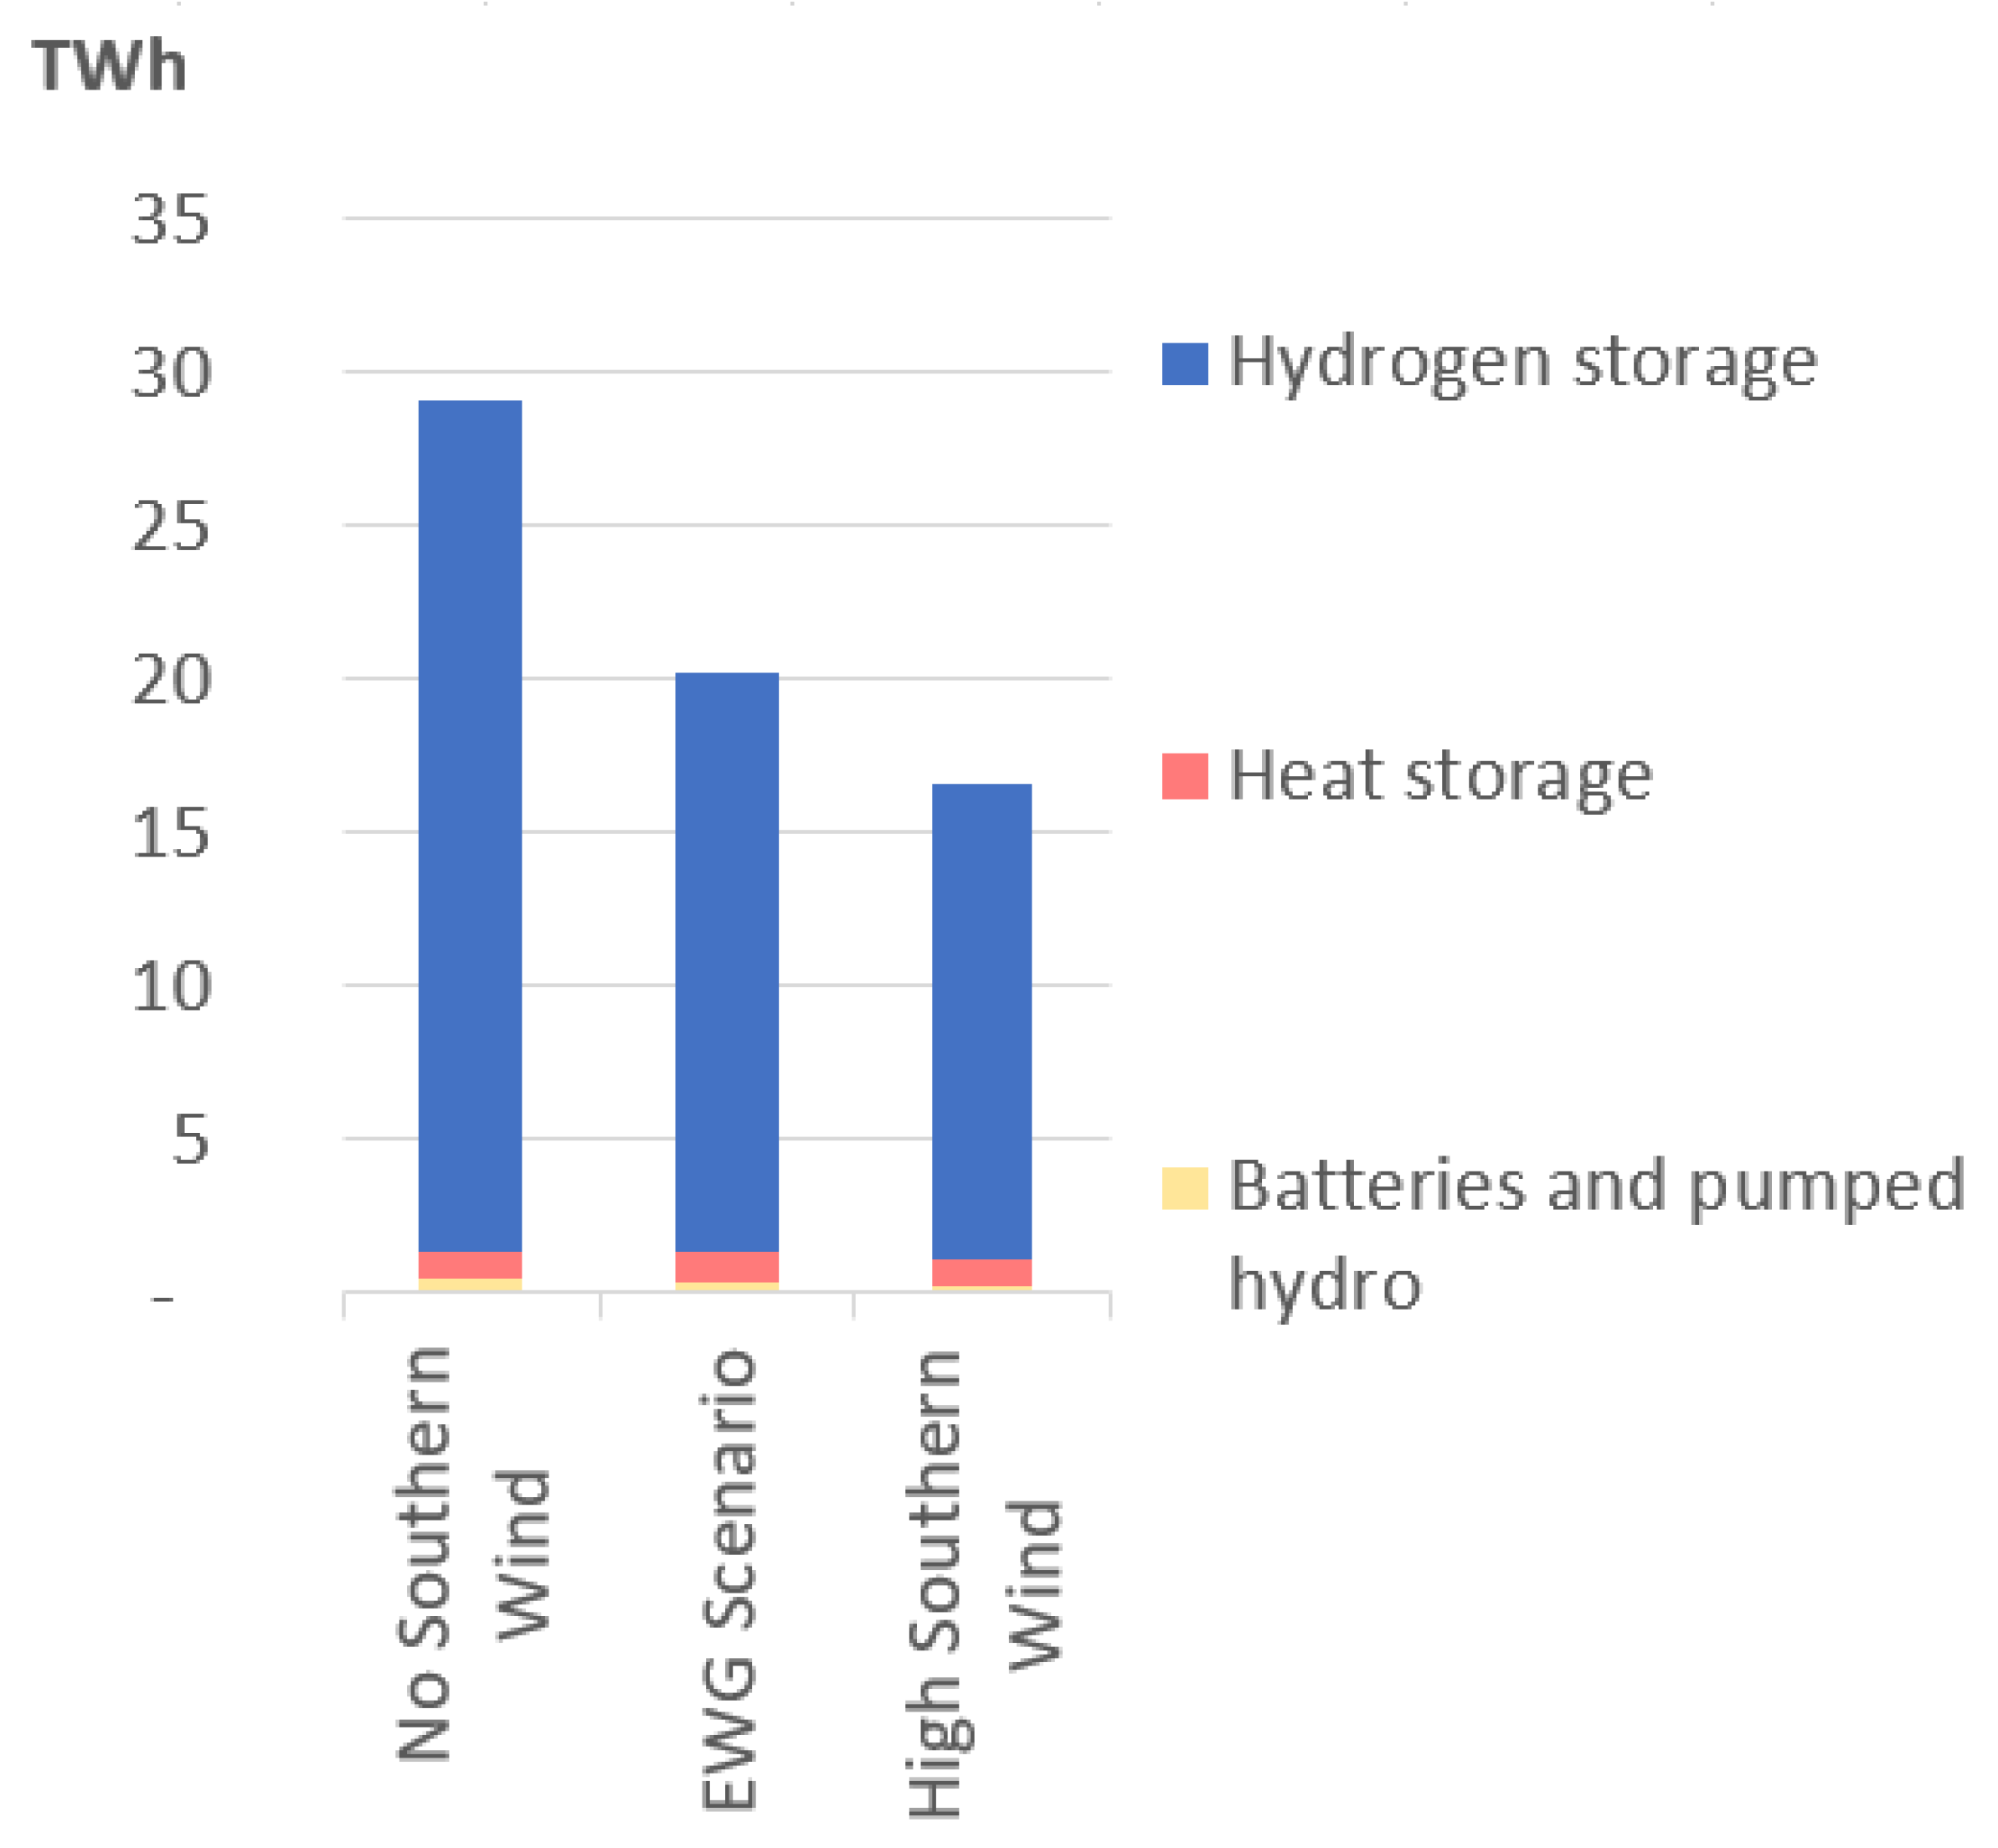
To store fluctuating renewable energy and use it when there is scarcity, energy storage capacities of almost 20 TWh are needed in the target scenario, of which hydrogen storage systems are by far the largest part. These are used to the extent of more than 311 TWh for energy supply (EWG Scenario, Figure 7). In terms of energy provision of storage technologies, the largest share is also contributed for by green hydrogen, but heat and batteries provide combined more than 50%. Batteries and thermal storage are loaded and unloaded almost in a daily cycle. The abandonment of wind energy expansion in southern Germany (No Southern Wind) leads to a significant increase of 44% in the demand for storage capacity. Increasing the onshore wind in southern Germany at double the rate (High Southern Wind) compared to the (EWG Scenario leads to a less pronounced effect in the opposite direction (−18%), which shows the diminishing opportunities of substituting wind for storage.
4.5. Costs of EUR 76 per MWh Possible in 100% RE System
The target system enables the conversion to an energy system at competitive prices. On average, a cost of EUR 76 per MWh has to be recovered. In contrast, the abandonment of wind energy expansion in southern Germany would significantly jeopardize the competitiveness of energy costs (No Southern Wind). In that scenario, the costs of energy provision in Germany as a whole would increase significantly by 23% compared to the EWG Scenario. Increasing wind energy in southern Germany beyond the EWG Scenario would lead to further potential cost savings of 10%.
The emergence of these cost differences can be seen in Figure 8. The annual costs for the minimum cost target system with 100% RE in Germany are EUR 155 billion and compare favorably with the costs of the current system. They include operating and fuel costs of about EUR 36 billion and annuities of EUR 119 billion. In addition to the investments for new plants, they contain the remaining capital costs of the existing plants, which are assumed to be already 50% percent depreciated in 2030. Varying the wind resources in southern Germany changes the total annual costs from EUR 191 to 130 billion for the No Southern Wind and High Southern Wind sensitivities, respectively. The cost of storage capacity is shown in Figure 8 above the slanted striped costs for HVDC and accounts for more than 20% of the total costs in all scenarios. They are expected to be roughly halved by international integration of energy systems, demand-side management, and smart use of vehicle batteries.
4.6. Required Capacity Expansion in Germany for Zero Emissions in 2030
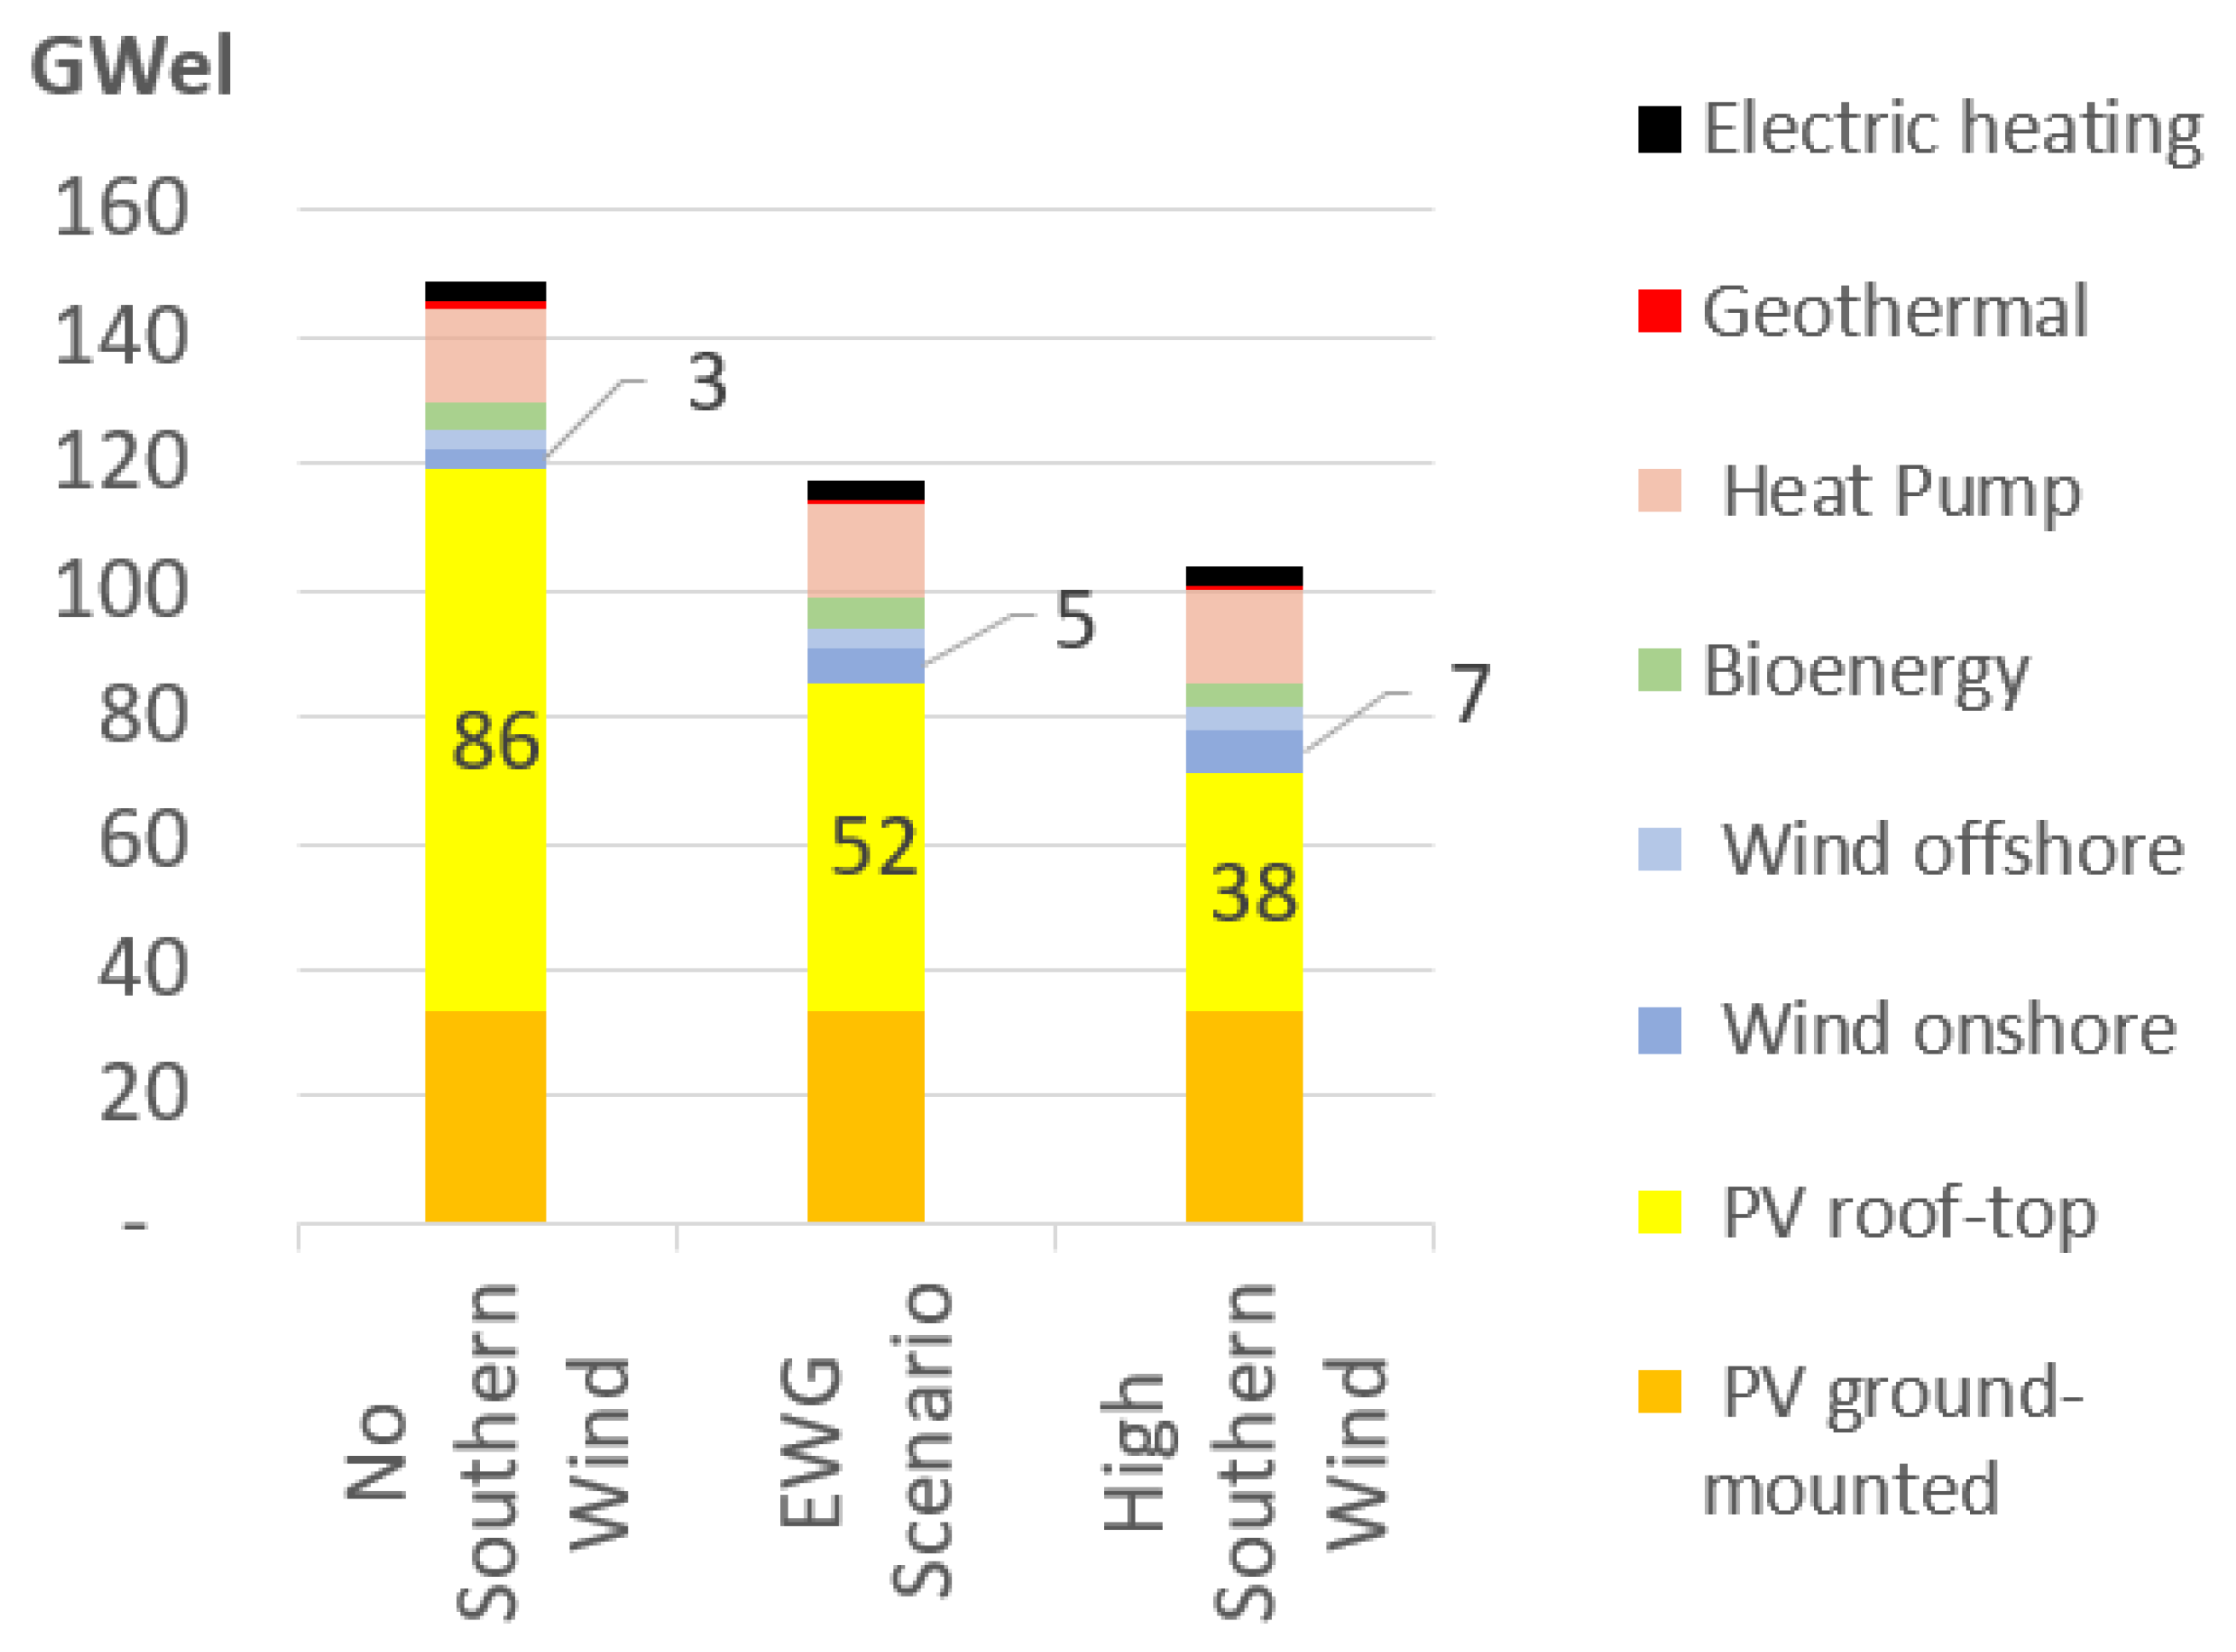
Figure 9 shows the necessary annual expansion in the electricity, heat, and transport sectors to achieve zero emissions in Germany by 2030. This shows the prominent role that solar technologies play in the transition to 100% RE. Photovoltaic (PV) installations need to be developed the most with 85 GW of annual expansion, of which 34 GW are ground-mounted PV and 52 GW are building PV installations. The growth of heat pumps (15 GW annually), which convert electricity into heat with high efficiency, is also particularly important for the energy transition. To ensure electric heat supply, 3 GW of electric heating must be added annually. Wind energy, which is the second most important energy source after PV, needs to grow at nearly 9 GW annually, including 5 GW of onshore wind turbines and 3.3 GW of offshore wind turbines. Bioenergies require 4 GW of annual growth. Abandoning wind power expansion in southern Germany, amounting to an average of 2 GW per year, would have to be offset by a disproportionately higher expansion of PV plants in No Southern Wind. However, increasing the rate of the wind roll-out further has an under-proportional effect on necessary PV expansion.
4.7. Necessary Expansion of the High-Voltage Grid
The economic expansion of high-voltage direct-current (HVDC) transmission lines amounts to 7.6 GW. In addition, the existing transport capacity of the high-voltage grid estimated at 8.9 GW and is considerably lower than the announced plans of the policy. The German government and Federal Network Agency plan a total of 12 GW of HVDC transmission capacity to connect the north and south [35]. These plans were made for achieving a renewables share of 65% in 2035 and an only slightly growing electricity consumption of 650 TWh, although a much stronger increase in electricity consumption is expected due to sector coupling. However, our results suggest that with an increase of the (so far insufficient) renewable energy target to 100%, and with progressing sector integration—e.g., hydrogen and electromobility—a transmission capacity expansion of 1.5 GW below the planned 18 GW will be sufficient. We find an indicated total transmission capacity of 16.5 GW in the EWG Scenario. There will also be a correspondigly reduced need for grid expansion on the connected high- and low-voltage grid levels in order to integrate and utilize these capacities. Thus, the current grid planning is already economically hardly justifiable and indicates a major bottleneck for energy transition in Germany.
5. Limitations
Our energy system presented here does not take into account the possibilities arising from the international electricity transmission system. In addition to and as a substitute for hydrogen storage, which provides a main pillar here, the European interconnected system, especially with pumped storage and reservoirs in the neighboring Alps and Scandinavia, can be used to meet this storage need. The same applies to intelligent, especially bidirectional, charging of electrical storage from e-mobility. In addition, important sectors such as cement production and the metal and chemical industries, which can also provide flexibility and limit the need for storage, are not included in the analysis. However, these sectors are necessary to fully remove human emissions from the materials and energy sectors. Only this would allow a reduction in atmospheric green house gas concentrations if sinks are established by agriculture, forestry, and in water and marine management. Another not fully resolved problem concerns the incorporation of long-term weather expectations in the systematic analysis. Here, the state of the art is to use a full-year representation of 8760 historical hours. In this case, the choice of reference year appears to be important, as noted for Europe by Koivisto et al. [34]. However, these approaches based on historical weather events are not particularly suitable for integrating the effects of climate change on weather forecasting. It is proposed to review the impact of weather research and forecasting methods [36] and improve the choice of probability weights that balance robustness to weather shocks while minimizing the cost of operation under intermediate conditions in power system optimization. Such an approach seems particularly relevant for regions that are vulnerable to large annual variability combined with high expected seasonal variation in the relationship between demand and available renewables. In particular, these could be regions with a high wind share in a cost-minimized climate change pathway, which are obtainable in [37] and with detailed background information in Ref. [38].
Other options that are important to a future-proof system, but not considered here, arise from smart combinations of rapidly evolving technologies, including those across conventional sector boundaries. These include floating PV systems in combination with hydropower plants or with offshore wind farms, as well as agrivoltaics. Overall, other positive effects are triggered that are not included in the optimization. In detail, these are the creation of regional jobs and added value with structural development while eliminating the health damage caused by fossil energies.
6. Conclusions
The aim of the calculation was to develop a realistic estimate of the 100% renewable energy supply needed to achieve the climate targets based on current costs. It is shown that the necessary transition to 100% renewables for all energy sectors is possible at low cost with a steady expansion. A “business as usual” approach to energy policy proves to be expensive, especially regarding wind power. Moreover, not expanding wind power in the south leads to immensely high grid expansion needs. However, grid expansion alone would lead to a delay in Germany’s energy transition, which is likely to already preclude the achievement of the German share of the Paris climate target and compatibility of emissions with the 1.5 °C target. In addition, the abandonment of wind power in southern Germany increases the necessary additions to photovoltaic plants by forty percent compared to the already ambitious requirement of an average annual expansion of 85 GW. These quantities cannot be added in the coming year. Any potential expansion will therefore not occur at constant annual rates, but along an S-curve with an initial rapid increase in new installations until existing installation capacity is fully utilized. Only after the necessary lead time until sufficient domestic PV production capacities amounting to several gigafactories are available will a significantly faster expansion be possible in the second half of this decade.
Author Contributions
Conceptualization, T.T., F.S.H. and H.-J.F.; methodology, T.T.; software, T.T.; validation, T.T., F.S.H. and H.-J.F.; formal analysis, T.T.; investigation, T.T. and F.S.H.; resources, H.-J.F.; writing—original draft preparation, T.T. and F.S.H.; writing—review and editing, T.T. and F.S.H.; visualization, T.T.; supervision, T.T.; project administration, T.T. and H.-J.F.; funding acquisition, H.-J.F. All authors have read and agreed to the published version of the manuscript.
Funding
This research received no external funding.
Institutional Review Board Statement
Not applicable.
Informed Consent Statement
Not applicable.
Acknowledgments
The authors would like to thank Matti Koivisto for his straightforward support with the assessment of the wind power capacities and Christian Breyer for his advice and fruitful discussions. Further, the authors acknowledge all of the supporters and the Energy Watch Group, including the BMWI, for funding the open power system data platform (https://open-power-system-data.org/, accessed on 20 August 2021).
Conflicts of Interest
The authors declare no conflict of interest.
Abbreviations
The following abbreviations are used in this manuscript:
| Total levelized cost of energy | |
| Capital renumeration factor | |
| Fixed costs of technologies denoted n | |
| Installed capacity | |
| Variable costs of energy provision of technologies denoted n | |
| Frequency of simulated time step t | |
| q | Generation quantity |
| Fuel prices of technologies denoted n | |
| Degrees of efficiency of technologies denoted n | |
| Operating costs of technologies denoted n | |
| Electricity generation in all electricity technologies L | |
| Battery charging current | |
| Hydrolysis current | |
| Heat pump electricity | |
| Net exports to other regions | |
| Classical electricity consumption in every time step t and every region r | |
| Region, i.e., northern Germany or southern Germany | |
| Transport technology | |
| Heat generation in heat technologies M | |
| Heat index | |
| Heat index of CHP plants | |
| Heat storage demand | |
| Heat consumption | |
| K | New installed capacity |
| Existing capacity | |
| Total installed capacity | |
| Unavailability | |
| Energy generation | |
| Charging level of storage technology in time step t | |
| Charging level of storage technology in time step T | |
| Charging energy | |
| Discharging energy |
Appendix A. Technical and Economic Assumptions

Table A1.
Capital expenditure (CAPEX), variable, and fixed operational expenditure (OPEX) of conversion technologies, and charging, discharging, and long-term degrees of efficiency ().
Table A1.
Capital expenditure (CAPEX), variable, and fixed operational expenditure (OPEX) of conversion technologies, and charging, discharging, and long-term degrees of efficiency ().
| CAPEX (EUR/kW) | OPEX Fix (EUR/kW*a) | OPEX var (EUR/kW*h) | CRF (n) | ||||
|---|---|---|---|---|---|---|---|
| PV ground-mounted | 320 | 13.20 | – | 0.07 | 1.00 | 1.00 | 1.00 |
| PV rooftop | 720 | 17.60 | – | 0.07 | 1.00 | 1.00 | 1.00 |
| Wind onshore | 1100 | 21.00 | – | 0.07 | 1.00 | 1.00 | 1.00 |
| Wind offshore | 2580 | 83.70 | – | 0.07 | 1.00 | 1.00 | 1.00 |
| Bioenergy CHP large | 429 | 17.20 | 0.08 | 0.07 | 1.00 | 0.35 | 1.00 |
| Bioenergy CHP small | 2500 | 17.20 | 0.08 | 0.07 | 1.00 | 0.30 | 1.00 |
| Battery storage | 100 | 9.00 | – | 0.08 | 0.98 | 0.98 | 1.00 |
| Battery and pumped storage power | 100 | – | – | 0.08 | 1.00 | 1.00 | 1.00 |
| Run-of-river hydro | – | – | – | 0.05 | 1.00 | 1.00 | 1.00 |
| Heat pump | 750 | 15.60 | – | 0.07 | 3.57 | 3.57 | 1.00 |
| Heat storage | 30 | 0.60 | – | 0.06 | 0.95 | 0.95 | 0.95 |
| Hydrogen storage | 14 | – | – | 0.07 | 0.99 | 0.99 | 0.98 |
| Hydrogen compressor | 256 | 0.86 | – | 0.10 | 0.98 | 1.00 | 1.00 |
| Hydrogen electrolyzer | 500 | 1.11 | 0.00 | 0.07 | 0.60 | 0.99 | 0.99 |
| Gas and steam power plant with hydrogen combustion | 975 | – | 0.00 | 0.06 | 1.00 | 0.60 | 1.00 |
| Geothermal | 4470 | – | – | 0.06 | 1.00 | 1.00 | 1.00 |
| HVDC (per 500 km) | 984 | 1.50 | – | 0.05 | 0.99 | 0.99 | 1.00 |
| Electric heating | 200 | – | – | 0.05 | 1.00 | 1.00 | 1.00 |
Appendix B. Results for Northern and Southern Germany
Figure A1.
The necessary energy conversion capacity in northern and southern Germany roughly reflects the ratio of consumption of 3:2 between the north and south in the EWG Scenario and under the High Southern Wind assumption. If wind power is not expanded in southern Germany, substantially higher PV capacities are needed, reflecting an increase in storage losses and curtailment. Moreover, the demand for new HVDC lines—assigned to the southern bars here—increases by more than 60 percent.

Figure A2.
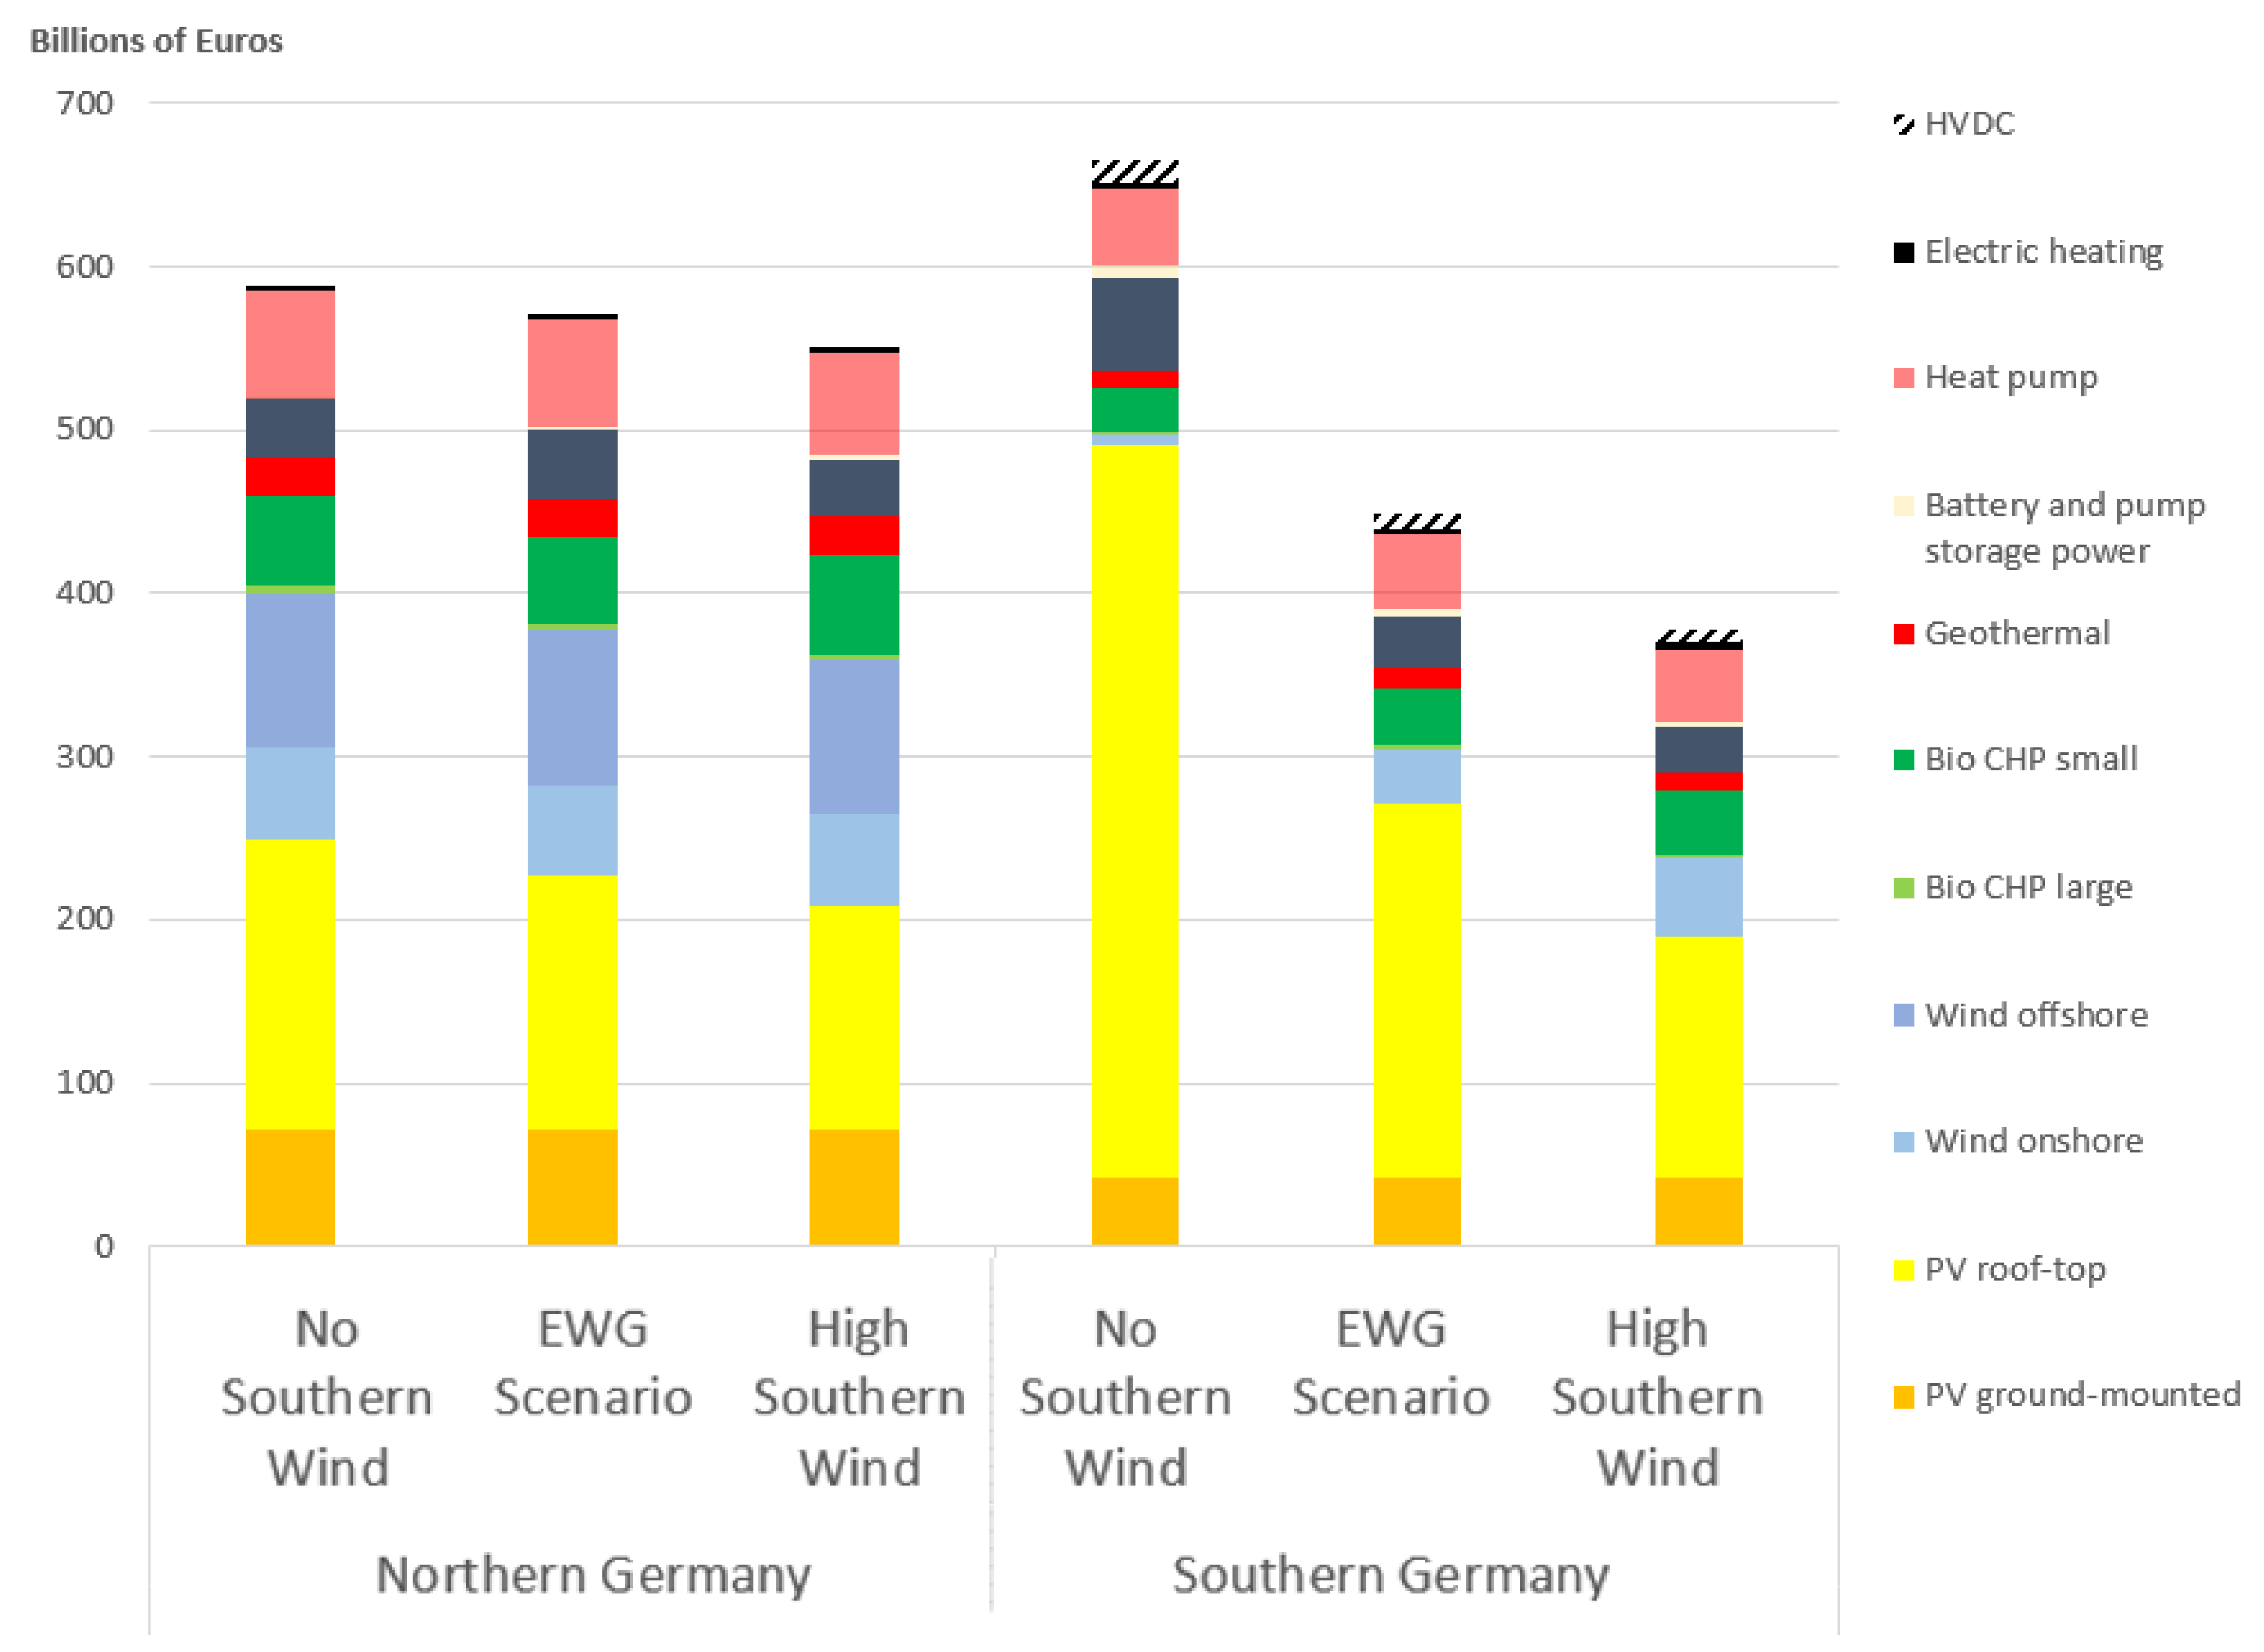
Total costs of energy provision over the 20–50-year lifetime of investments are greatly affected by the wind energy policy in southern Germany, where energy costs increase drastically with the renunciation of roll-out.
Figure A2.
Total costs of energy provision over the 20–50-year lifetime of investments are greatly affected by the wind energy policy in southern Germany, where energy costs increase drastically with the renunciation of roll-out.

References
- Hansen, K.; Breyer, C.; Lund, H. Status and perspectives on 100% renewable energy systems. Energy 2019, 175, 471–480. [Google Scholar] [CrossRef]
- Palzer, A.; Henning, H.M. A comprehensive model for the German electricity and heat sector in a future energy system with a dominant contribution from renewable energy technologies—Part II: Results. Renew. Sustain. Energy Rev. 2014, 30, 1019–1034. [Google Scholar] [CrossRef]
- Lunz, B.; Stöcker, P.; Eckstein, S.; Nebel, A.; Samadi, S.; Erlach, B.; Fischedick, M.; Elsner, P.; Sauer, D.U. Scenario-based comparative assessment of potential future electricity systems–A new methodological approach using Germany in 2050 as an example. Appl. Energy 2016, 171, 555–580. [Google Scholar] [CrossRef] [Green Version]
- Prina, M.G.; Manzolini, G.; Moser, D.; Nastasi, B.; Sparber, W. Classification and challenges of bottom-up energy system models—A review. Renew. Sustain. Energy Rev. 2020, 129, 109917. [Google Scholar] [CrossRef]
- Lyden, A.; Pepper, R.; Tuohy, P.G. A modelling tool selection process for planning of community scale energy systems including storage and demand side management. Sustain. Cities Soc. 2018, 39, 674–688. [Google Scholar] [CrossRef]
- Xu, Y.; Yan, C.; Liu, H.; Wang, J.; Yang, Z.; Jiang, Y. Smart energy systems: A critical review on design and operation optimization. Sustain. Cities Soc. 2020, 62, 102369. [Google Scholar] [CrossRef]
- Fridgen, G.; Keller, R.; Körner, M.F.; Schöpf, M. A holistic view on sector coupling. Energy Policy 2020, 147, 111913. [Google Scholar] [CrossRef]
- Kiss, V.M. Modelling the energy system of Pécs–The first step towards a sustainable city. Energy 2015, 80, 373–387. [Google Scholar] [CrossRef]
- Dominković, D.; Bačeković, I.; Sveinbjörnsson, D.; Pedersen, A.; Krajačić, G. On the way towards smart energy supply in cities: The impact of interconnecting geographically distributed district heating grids on the energy system. Energy 2017, 137, 941–960. [Google Scholar] [CrossRef] [Green Version]
- Sveinbjörnsson, D.; Amer-Allam, S.B.; Hansen, A.B.; Algren, L.; Pedersen, A.S. Energy supply modelling of a low-CO2 emitting energy system: Case study of a Danish municipality. Appl. Energy 2017, 195, 922–941. [Google Scholar] [CrossRef] [Green Version]
- Barragán-Escandón, E.A.; Zalamea-León, E.F.; Terrados-Cepeda, J.; Vanegas-Peralta, P. Energy self-supply estimation in intermediate cities. Renew. Sustain. Energy Rev. 2020, 129, 109913. [Google Scholar] [CrossRef]
- Sola, A.; Corchero, C.; Salom, J.; Sanmarti, M. Multi-domain urban-scale energy modelling tools: A review. Sustain. Cities Soc. 2020, 54, 101872. [Google Scholar] [CrossRef]
- Jacobson, M.Z.; Delucchi, M.A. Providing all global energy with wind, water, and solar power, Part I: Technologies, energy resources, quantities and areas of infrastructure, and materials. Energy Policy 2011, 39, 1154–1169. [Google Scholar] [CrossRef]
- Delucchi, M.A.; Jacobson, M.Z. Providing all global energy with wind, water, and solar power, Part II: Reliability, system and transmission costs, and policies. Energy Policy 2011, 39, 1170–1190. [Google Scholar] [CrossRef]
- Jacobson, M.Z.; Delucchi, M.A.; Bauer, Z.A.F.; Goodman, S.C.; Chapman, W.E.; Cameron, M.A.; Bozonnat, C.; Chobadi, L.; Clonts, H.A.; Enevoldsen, P.; et al. 100% clean and renewable wind, water, and sunlight all-sector energy roadmaps for 139 countries of the world. Joule 2017, 1, 108–121. [Google Scholar] [CrossRef] [Green Version]
- Child, M.; Koskinen, O.; Linnanen, L.; Breyer, C. Sustainability guardrails for energy scenarios of the global energy transition. Renew. Sustain. Energy Rev. 2018, 91, 321–334. [Google Scholar] [CrossRef]
- Connolly, D.; Lund, H.; Mathiesen, B. Smart Energy Europe: The technical and economic impact of one potential 100% renewable energy scenario for the European Union. Renew. Sustain. Energy Rev. 2016, 60, 1634–1653. [Google Scholar] [CrossRef]
- Brown, T.; Schlachtberger, D.; Kies, A.; Schramm, S.; Greiner, M. Synergies of sector coupling and transmission reinforcement in a cost-optimised, highly renewable European energy system. Energy 2018, 160, 720–739. [Google Scholar] [CrossRef] [Green Version]
- Zappa, W.; Junginger, M.; van den Broek, M. Is a 100% renewable European power system feasible by 2050? Appl. Energy 2019, 233, 1027–1050. [Google Scholar] [CrossRef]
- Tröndle, T.; Lilliestam, J.; Marelli, S.; Pfenninger, S. Trade-offs between geographic scale, cost, and infrastructure requirements for fully renewable electricity in Europe. Joule 2020, 4, 1929–1948. [Google Scholar] [CrossRef] [PubMed]
- Lund, H.; Mathiesen, B.V. Energy system analysis of 100% renewable energy systems—The case of Denmark in years 2030 and 2050. Energy 2009, 34, 524–531. [Google Scholar] [CrossRef]
- Mathiesen, B.V.; Lund, H.; Karlsson, K. 100% Renewable energy systems, climate mitigation and economic growth. Appl. Energy 2011, 88, 488–501. [Google Scholar] [CrossRef]
- Connolly, D.; Mathiesen, B.V. A technical and economic analysis of one potential pathway to a 100% renewable energy system. Int. J. Sustain. Energy Plan. Manag. 2014, 1, 7–28. [Google Scholar]
- Yue, X.; Patankar, N.; Decarolis, J.; Chiodi, A.; Rogan, F.; Deane, J.; O’Gallachoir, B. Least cost energy system pathways towards 100% renewable energy in Ireland by 2050. Energy 2020, 207, 118264. [Google Scholar] [CrossRef]
- Child, M.; Ilonen, R.; Vavilov, M.; Kolehmainen, M.; Breyer, C. Scenarios for sustainable energy in Scotland. Wind Energy 2019, 22, 666–684. [Google Scholar] [CrossRef]
- Bellocchi, S.; Manno, M.; Noussan, M.; Prina, M.G.; Vellini, M. Electrification of transport and residential heating sectors in support of renewable penetration: Scenarios for the Italian energy system. Energy 2020, 196, 117062. [Google Scholar] [CrossRef]
- Child, M.; Breyer, C. Vision and initial feasibility analysis of a recarbonised Finnish energy system for 2050. Renew. Sustain. Energy Rev. 2016, 66, 517–536. [Google Scholar] [CrossRef]
- Gils, H.C.; Pregger, T.; Flachsbarth, F.; Jentsch, M.; Dierstein, C. Comparison of spatially and temporally resolved energy system models with a focus on Germany’s future power supply. Appl. Energy 2019, 255, 113889. [Google Scholar] [CrossRef]
- Hansen, K.; Mathiesen, B.V.; Skov, I.R. Full energy system transition towards 100% renewable energy in Germany in 2050. Renew. Sustain. Energy Rev. 2019, 102, 1–13. [Google Scholar] [CrossRef]
- Bogdanov, D.; Gulagi, A.; Fasihi, M.; Breyer, C. Full energy sector transition towards 100% renewable energy supply: Integrating power, heat, transport and industry sectors including desalination. Appl. Energy 2021, 283, 116273. [Google Scholar] [CrossRef]
- Bundesministerium für Wirtschaft und Energie, BMWI. Gesamtausgabe der Energiedaten–Datensammlung des BMWI. 2021. Available online: https://www.bmwi.de/Redaktion/DE/Binaer/Energiedaten/energiedaten-gesamt-xls.xlsx?_blob=publicationFile&v=133 (accessed on 20 August 2021).
- Nahmacher, P.; Paris, C.; Ruge, M.; Spieker, S.; Anderski, T.; Bohlen, S.; Kaiser, R.; Podewski, C.; Apfelbeck, J.; Kahl, T.; et al. Szenariorahmen zum Netzentwicklungsplan Strom 2035. 2020. Available online: https://www.netzentwicklungsplan.de/de/netzentwicklungsplaene/netzentwicklungsplan-2035-2021 (accessed on 20 August 2021).
- Fath, K. Technical and Economic Potential for Photovoltaic Systems on Buildings; KIT Scientific Publishing: Karlsruhe, Germany, 2018. [Google Scholar] [CrossRef]
- Koivisto, M.; Plakas, K.; Hurtado Ellmann, E.R.; Davis, N.; Sørensen, P. Application of microscale wind and detailed wind power plant data in large-scale wind generation simulations. Electr. Power Syst. Res. 2021, 190, 106638. [Google Scholar] [CrossRef]
- Fraunholz, C.; Hladik, D.; Keles, D.; Möst, D.; Fichtner, W. On the long-term efficiency of market splitting in Germany. Energy Policy 2021, 149, 111833. [Google Scholar] [CrossRef]
- Skamarock, W.C.; Klemp, J.B.; Dudhia, J.; Gill, D.O.; Barker, D.M.; Wang, W.; Powers, J.G. A Description of the Advanced Research WRF Version University Corporation for Atmospheric Research, doi:10.5065/D6DZ069T. Technical Report. National Center For Atmospheric Research Boulder Co Mesoscale and Microscale, 2005. Available online: https://opensky.ucar.edu/islandora/object/technotes:479 (accessed on 20 August 2021).
- Bogdanov, D.; Ram, M.; Aghahosseini, A.; Gulagi, A.; Oyewo, A.S.; Child, M.; Caldera, U.; Sadovskaia, K.; Farfan, J.; De Souza Noel Simas Barbosa, L.; et al. Low-cost renewable electricity as the key driver of the global energy transition towards sustainability. Energy 2021, 227, 120467. [Google Scholar] [CrossRef]
- Ram, M.; Bogdonov, D.; Aghahosseini, A.; Gulagi, A.; Oyewo, S.A.; Child, M.; Caldera, U.; Sadovskaia, K.; Farfan, J.; Barbosa, L.S.; et al. Global Energy System based on 100% Renewable Energy Energy Transition in Europe Across Power, Heat, Transport and Desalination Sectors; Lappeenranta University of Technology: Lappeenranta, Finland, 2018. [Google Scholar]
Figure 1.
Load coverage in northern Germany in January 2017. Under extremely weak wind conditions, as on 18 January, coverage is made up by bioenergy, hydrogen, and by imports from southern Germany.
Figure 1.
Load coverage in northern Germany in January 2017. Under extremely weak wind conditions, as on 18 January, coverage is made up by bioenergy, hydrogen, and by imports from southern Germany.

Figure 2.
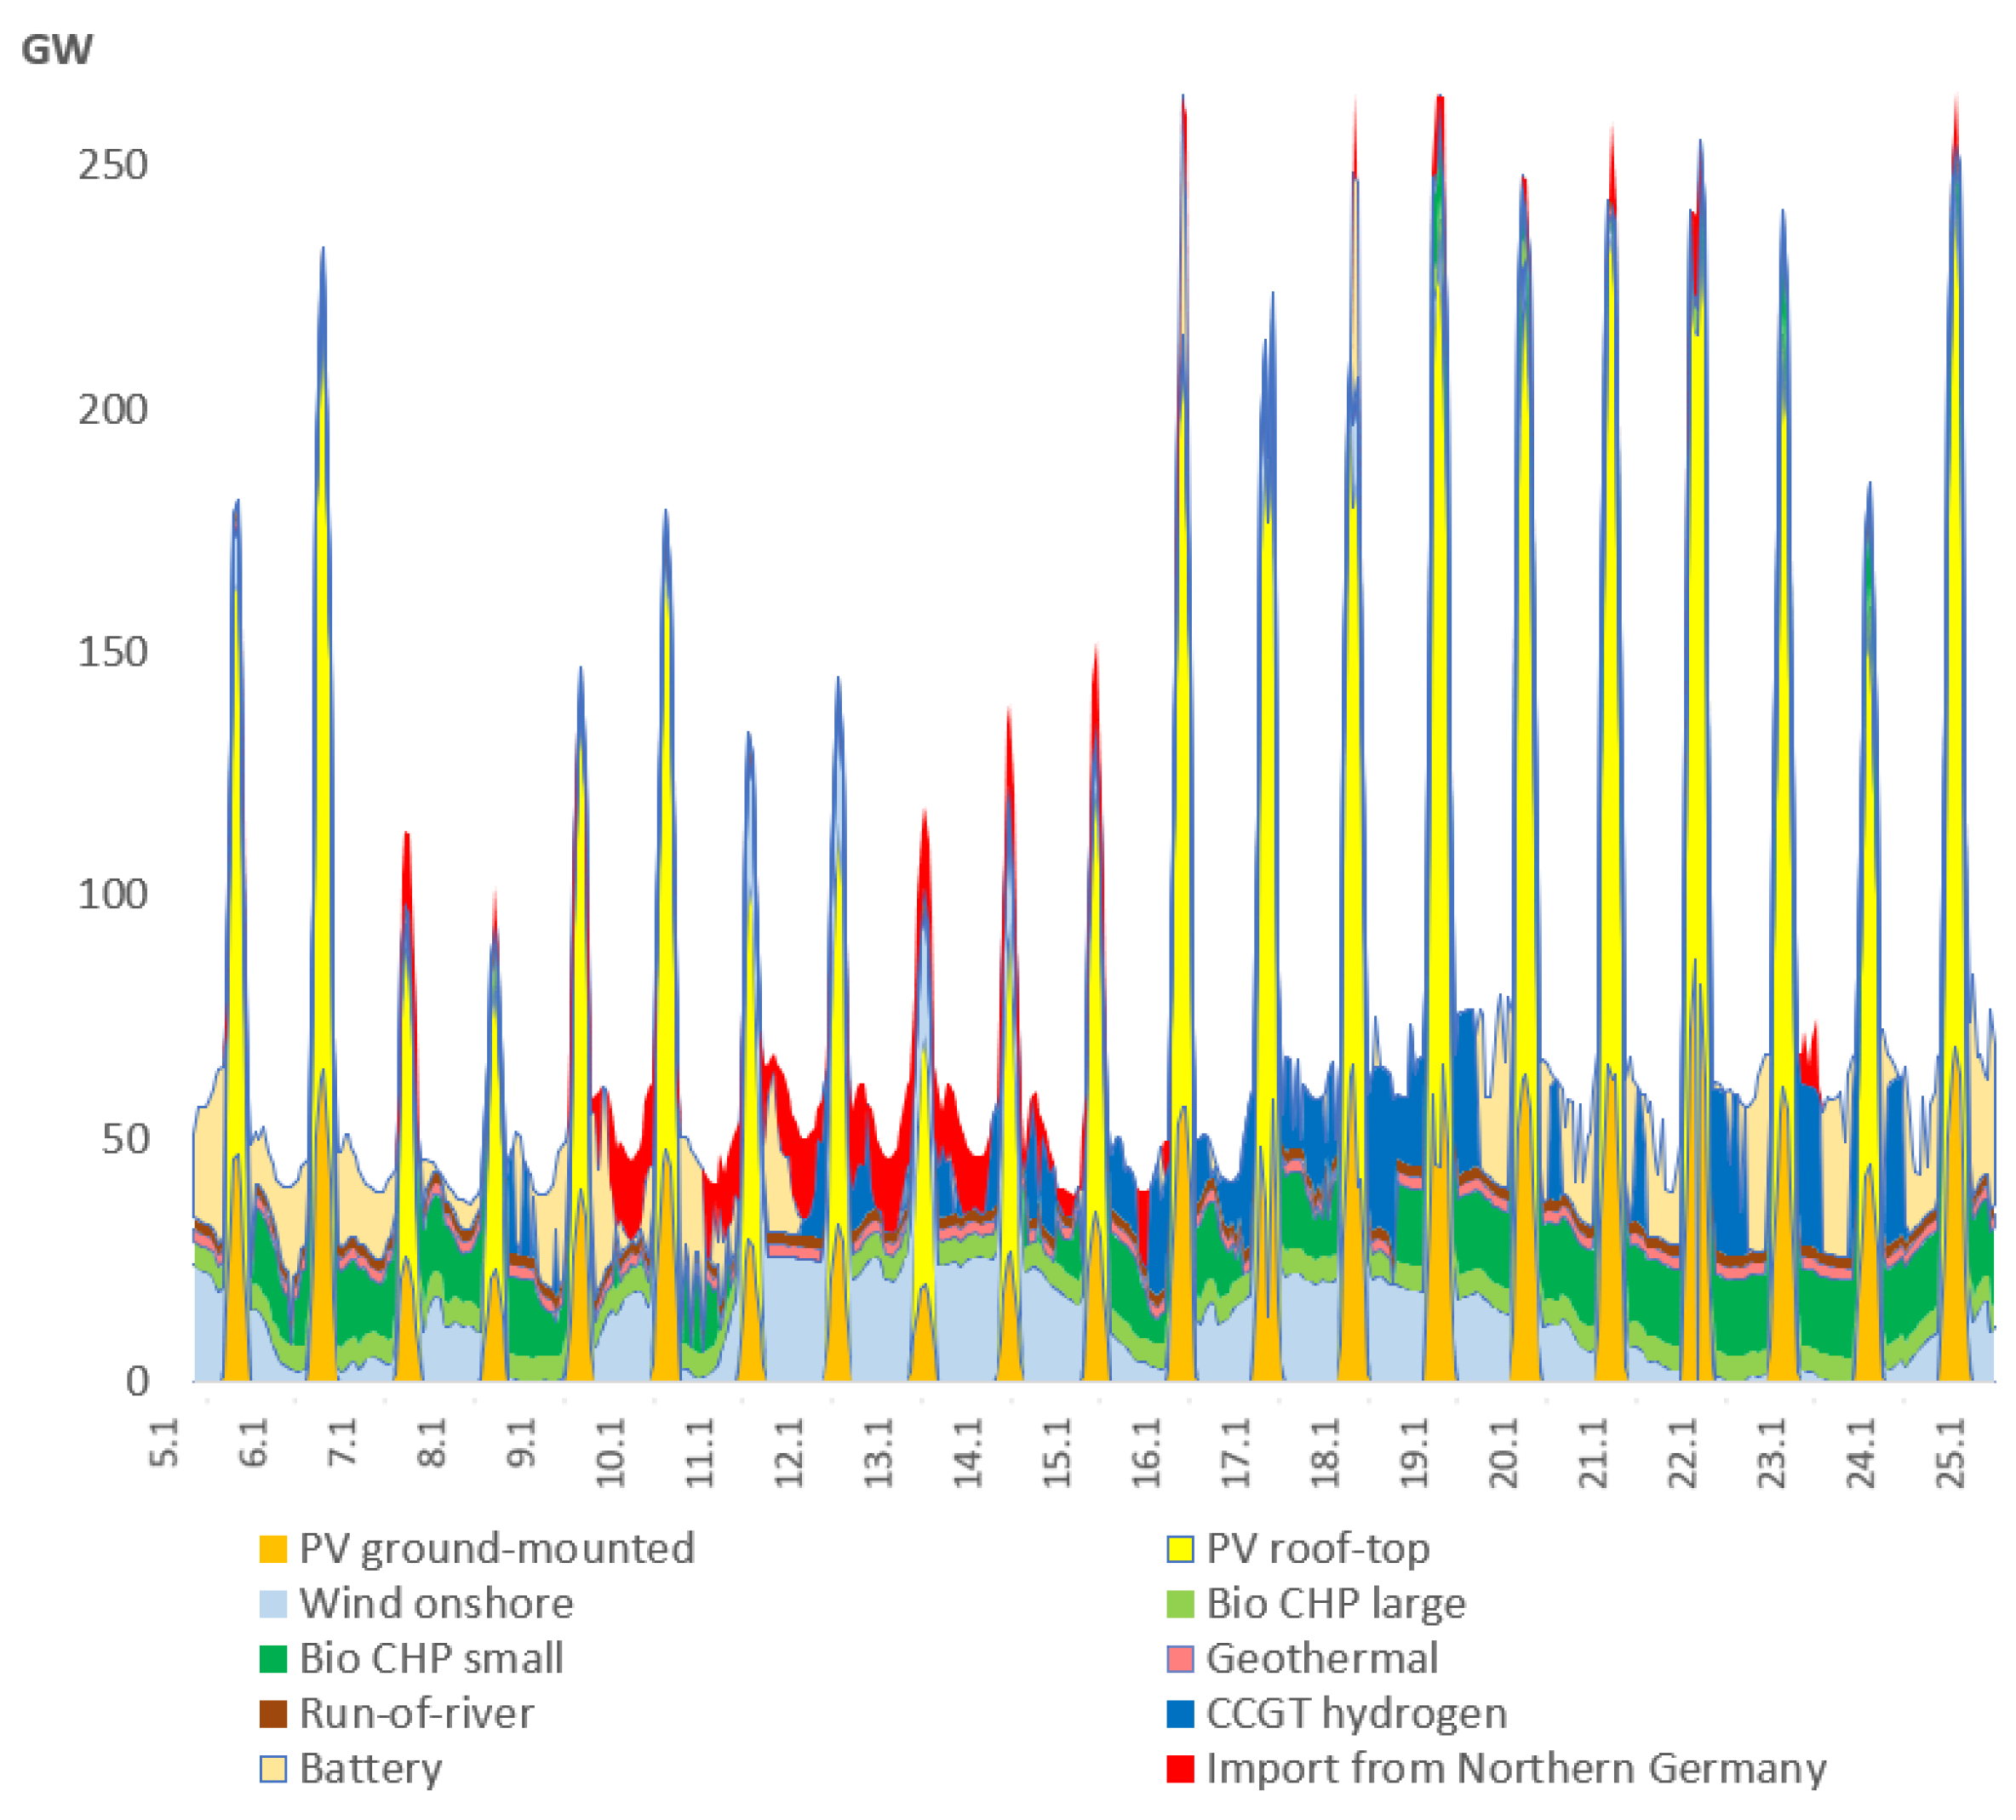
Load coverage in southern Germany in January 2017. Critical periods with particularly weak sunshine, as on 11–15 January, will be absorbed by bioenergy, hydrogen, and imports from northern Germany.
Figure 2.
Load coverage in southern Germany in January 2017. Critical periods with particularly weak sunshine, as on 11–15 January, will be absorbed by bioenergy, hydrogen, and imports from northern Germany.

Figure 3.
Energy use and losses (left graph) and energy costs in (right graph) 2018. ° Conversion and grid losses including non-energy use; * cost of CO2 emissions assuming EUR 50 per ton. For the costs net consumer prices were taken for mineral oil; fixed costs of 30%, 55%, and 50% were added for natural gas, lignite, and hard coal, respectively, to the fuel costs; renewable EEG payments and biofuel were taken at net consumer prices for mineral oil. Data: AGEE (2021), BMWi (2021), UBA (2021) [31]; own calculations.

Figure 4.
Generation, consumption, and physical import and export balances of the German states in 2018 in TWh. Values were calculated based on gross electricity generation profiles from the Federal Office of Statistics, https://www.destatis.de (accessed on 20 August 2021), renewable energy parts are available at https://www.foederal-erneuerbar.de (accessed on 20 August 2021), and net currents are taken from the Federal Network Agency and Federal Cartel Office.

Figure 5.
Capacities for a CO2-free energy system in northern and southern Germany for the three scenarios of EWG Scenario, No Southern Wind, and High Southern Wind: forgoing wind power expansion in southern Germany doubles the required high-voltage direct-current (HVDC) grid expansion.
Figure 5.
Capacities for a CO2-free energy system in northern and southern Germany for the three scenarios of EWG Scenario, No Southern Wind, and High Southern Wind: forgoing wind power expansion in southern Germany doubles the required high-voltage direct-current (HVDC) grid expansion.

Figure 6.
Final energy supply and electricity generation in Germany (in TWh) in the scenarios; for comparison, the left bar represents the final energy supply in 2018. In particular, electrification of the transport and heating sectors, which were still largely based on fossil fuels in 2018 (light gray and black), yields significant efficiency improvements in the target scenario (EWG Scenario).

Figure 7.
Capacities of storage technologies.

Figure 8.
Annual energy system costs (left axis) and levelized costs of energy (, right axis).

Figure 9.
Required average annual additions (in GW) for 100% RE in 2030 in Germany.

Table 1.
Installed RE generation capacities in 2020 and potentials in in northern and southern Germany. The potential of bioenergy usable in combined heat and power stations (CHP) is limited* by their primary energy potential of 200 TWh in northern Germany and 160 TWh in southern Germany. PV building potential based on Fath [33]. All other data are taken from the 2020 scenario framework [32].
| North | South | |||
|---|---|---|---|---|
| 2020 | Potential | 2020 | Potential | |
| PV ground-mounted | 8.4 | 221.2 | 4.7 | 128.8 |
| PV rooftop | 14.9 | >600 | 19.1 | >600 |
| Wind onshore | 44.6 | 73.3 | 10.7 | 36.7 |
| Wind offshore | 6.8 | 40.0 | - | - |
| Bioenergy CHP large* | - | 10.0 | 1.0 | 5.0 |
| Bioenergy CHP small* | 3.2 | energy limit | 3.8 | energy limit |
| Geothermal | - | 5.3 | 1.0 | 2.7 |
| Run-of-river hydro | 0.3 | 0.3 | 2.3 | 2.3 |
| Pumped-storage hydro | 2.5 | 2.5 | 4.0 | 4.0 |
Publisher’s Note: MDPI stays neutral with regard to jurisdictional claims in published maps and institutional affiliations. |
© 2021 by the authors. Licensee MDPI, Basel, Switzerland. This article is an open access article distributed under the terms and conditions of the Creative Commons Attribution (CC BY) license (https://creativecommons.org/licenses/by/4.0/).
Share and Cite
MDPI and ACS Style
Traber, T.; Hegner, F.S.; Fell, H.-J. An Economically Viable 100% Renewable Energy System for All Energy Sectors of Germany in 2030. Energies 2021, 14, 5230. https://doi.org/10.3390/en14175230
AMA Style
Traber T, Hegner FS, Fell H-J. An Economically Viable 100% Renewable Energy System for All Energy Sectors of Germany in 2030. Energies. 2021; 14(17):5230. https://doi.org/10.3390/en14175230
Chicago/Turabian StyleTraber, Thure, Franziska Simone Hegner, and Hans-Josef Fell. 2021. "An Economically Viable 100% Renewable Energy System for All Energy Sectors of Germany in 2030" Energies 14, no. 17: 5230. https://doi.org/10.3390/en14175230
Note that from the first issue of 2016, this journal uses article numbers instead of page numbers. See further details here.