Solar projects continue to underperform, resulting in millions of dollars of lost revenues, according to a new report.

Results of a global survey of solar projects in 2022 were shared by Raptor Maps as part of the project lifecycle software company’s fifth annual Global Solar Report. Raptor Maps surveyed 24.5 GW of solar PV last year, and found power loss relative to pro forma assumptions contributed to an estimated annual revenue loss of $82 million.
Extrapolated to the entire industry (excluding residential), revenue losses would likely total $2.5 billion, the firm said.
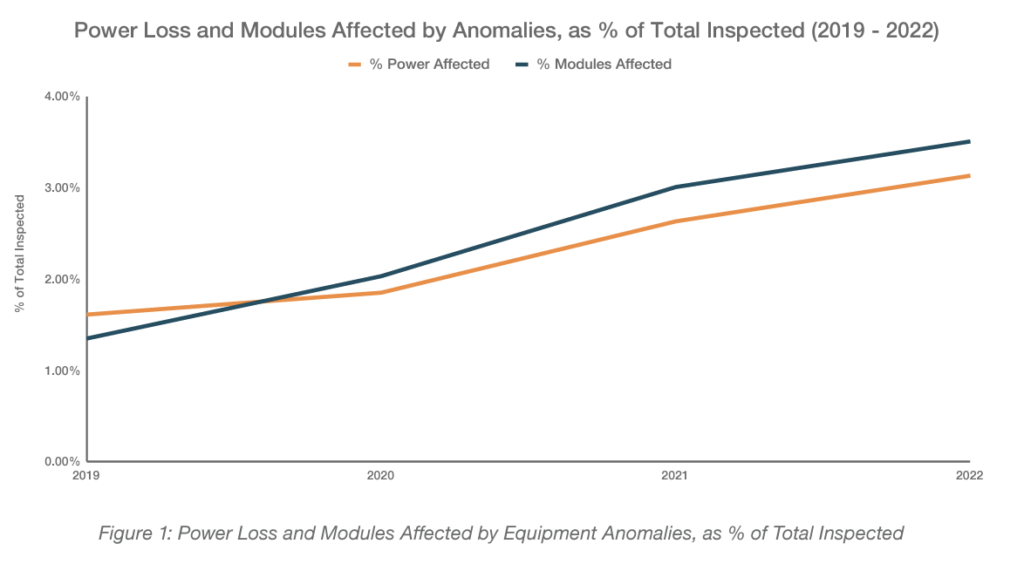
Raptor Maps said that underperformance due to project anomalies has nearly doubled from 1.61% in 2019 to 3.13% in 2022. For sites larger than 200 MW, average underperformance due to anomalies more than tripled since 2019, growing from 1.10% to 4.04% in 2022.
If anomaly driven power loss continued at the rate Raptor Maps observed, losses would grow to almost 6% by 2025.
Polycrystalline modules are more likely to show module-level and submodule-level anomalies on inspection compared to thin-film and monocrystalline modules, according to the analysis.
U.S. equipment-driven underperformance was pegged at 3.45% in 2022 compared to the global average of 3.13%.
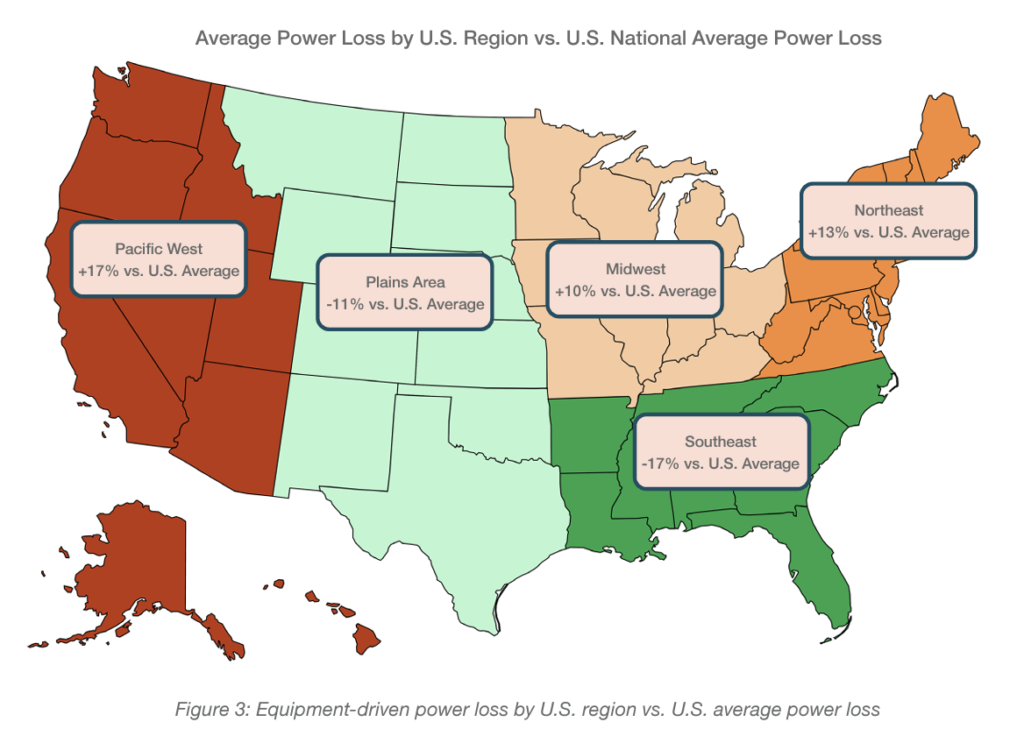
Broken down by region, underperformance affected projects in the Pacific Northwest the most at 17% above the national average. While the rate of underperformance was least severe in the Southeast (reported at 17% below the U.S. average), that region is the most prone to anomalies driven by physical damage (such as cracking, delamination, or warped modules). Such anomalies occur there at a rate 2.5 times that of the rest of the country.
The C&I performance challenge
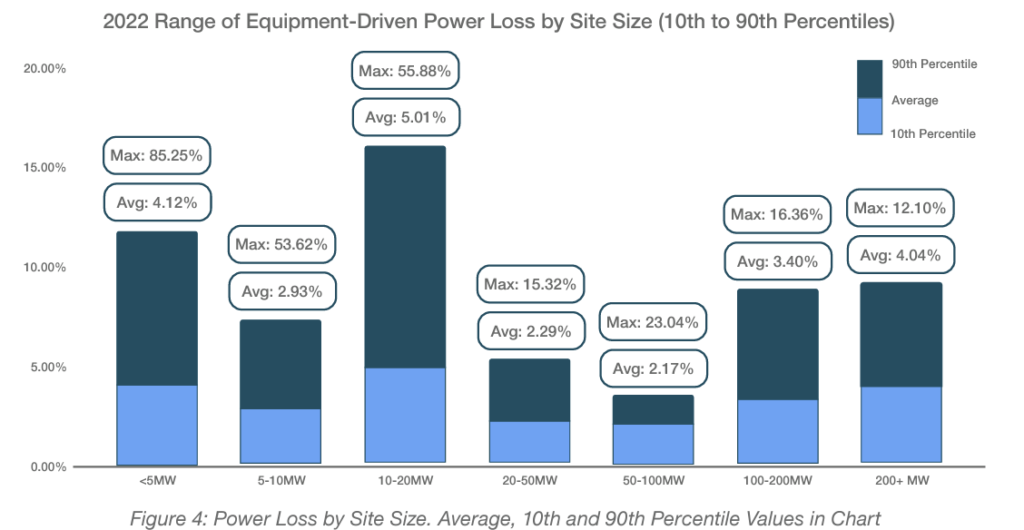
Smaller sites (less than 5 MW) exhibited the most variability in power loss and the highest average power loss as a percentage of their total generation capacity. These projects, largely embedded in the commercial & industrial segment, suffered equipment-drive power loss at an average of 4.12%.
Among larger installations, a smaller range was observed in power loss as a percentage of total site capacity. Even so, the largest sites tended to exhibit higher average power loss. Sites between 100 MW and 200 MW were 9% higher than the global average at 3.40% average power loss. And sites above 200 MW were 29% higher than the global average at 4.04% average power loss.
Sites larger than 200 MW were calculated to be losing, on average, around $4,320 per MW, with some sites losing up to $12,900 per MW, according to Raptor Maps.